

About
editThe package ChemCtrls contains controls optimized for usage in chemical applications:
TChemLabel(unit chemtext.pas): aTCustomLabeldescendant which can display chemical formulas and reaction equations with automatically placed subscripts and superscripts, as well as reaction arrows.- Unit chemgraphics.pas contains the drawing routines with sub/superscripts and arrows used by
TChemLabelfor general purposes. TPeriodicTable(unit chemperiodictbl.pas): a specializedTCustomDrawGridwhich displays the periodic table of elements, as well as any data associated with the elements.
Authors
edit- The code of
TChemLabeland related is based on "chemtxt" written by Patrick Spanel. It was adapted to Lazarus and extended by Werner Pamler. TPeriodicTablewas written by Werner Pamler.
License
editModified LGPL with linking exception (like Lazarus LCL)
Download and Installation
editRelease version
editThe release version of the package is made available in the Lazarus Online-Package-Manager (OPM). For installation simply check the "ChemCtrls" item in the package list and click on "Install". Confirm to rebuild the IDE. After a white the IDE restarts with the new component icons on tab "Misc" of the component palette.
The current release version is v0.1.
Development version
editThe development of the package is hosted on sourceforge.net in the [Lazarus Component and Code Repository (CCR) https://sourceforge.net/projects/lazarus-ccr/].
Use an svn client to checkout the current trunk version from svn://svn.code.sf.net/p/lazarus-ccr/svn/components/chemctrls/, or download the zipped snapshot from https://sourceforge.net/p/lazarus-ccr/svn/HEAD/tree/components/chemctrls/.
For installation, open Lazarus and go to menu "Package" > "Open Package File (.lpk)...". Navigate to the folder with the downloaded (and unzipped) ChemCtrls sources, and open the file chemctrls_pkg.lpk. Click "Use" > "Install". This will rebuild the IDE (it may take some time). When the process is finished the IDE will restart, and you'll find the components on the component palette "Misc".
TChemLabel
editUsage
edit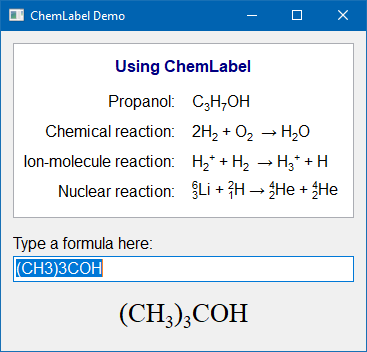 Simply drop a
TChemLabel component on the form and type the chemical formula/reaction into the property Caption.
The formulas are written in a straightforward way. The "2" in H2O is automatically subscripted, and the + in H+ is automatically displayed as superscript. A period "." is converted to a "hydrate dot" •. Note that multiple-charged ions must repeat the charge sign, i.e. the double-negatively charged oxygon ion must be written as O--, not as O2-.
For cases in which aligned subscripts and superscripts are required a special syntax with code symbols is available:
@: Save the current horizontal writing position|: Return to the saved horizontal writing position^: Write the next character as a superscript_: Write the next character as a subscript.
The size and offset of sub-/superscripts is determined by the following global integer variables:
SmallFontSizePercent= 67SubscriptFontOffsetPercent= 50SuperscriptFontOffsetPercent= 12
For chemical reactions, arrows can be entered as -->, <-- or <--> (the count of '-' is not critical). The enumeration property Arrow of the TChemLabel determines whether this simple ASCII symbol is to be replaced by a nicer UTF8 symbol:
caAsciiSingle: --> <-- <-->caAsciiDouble: ==> <== <==>caUTF8: → ← ⇌caUTF8Single: → ← ↔caUTF8Double: ⇒ ⇐ ⇔caUTF8Half: ⇀ ↽ ⇌
Note that the UTF8 characters may not be available in any font.
If the ChemLabel contains other text besides the chemial formula the processing of numerical digits, +, - and arrows may be undesired. Therefore, the characters '0'..'9', '+', '-', '<', and '>' can be escaped by writing a backslash in front of them. And the backslash itself can be used by doubling it.
Examples
- The ChemLabel normally displays "Text1" as "Text1". To avoid the subscripted "1", use the text "Text\1".
- To avoid the superscripted "-" in "ion-molecule reaction" use the text "ion\-molecule reaction".
- To display the file path "c:\data.txt" correctly use the text "c:\\data.txt"
Sample projects
editThe folder examples of the installation directory contains two demo projects for TChemLabel
- chemlabel_runtime: In the sample project in this folder, the
TChemLabelcomponent is created at runtime, i.e. installation of the chemctrls_pkg package is not required (it only must have been opened in the package editor once so that the IDE knows where it is). The project allows to study the effect of changing characteristic properties of the component. - chemlabel_demo: This demo displays several chemical formulas in <tt<TChemLabel controls. There is also a
TEditcontrol in which an (unformatted) chemical formula can be entered directly. The introductory screenshot was taken from this mini application.
Using the painting routine in other controls
editThe main painting routines of TChemLabel have been split off into a separate unit chemgraphics.pas so that they can be invoked in any owner-draw code of other components, e.g. a StringGrid.
function ChemTextOut(ACanvas: TCanvas; X, Y:integer; const AText: String; Arrow: TChemArrow = caAsciiSingle; Measure: Boolean = false): TSize;ACanvas: Canvas on which the chemical text will be paintedX,Y: Top/left coordinates of the position where the text will startAText: Text to be displayed. Numbers inserted between letters will be displayed as subscripts, + and - characters following a letter will be displayed as superscript. Reaction arrows can be inserted by '<-', '->', or '<->' (any number of '-' allowed). Special processing of these characters can be escaped by using a backslash ('\') in front of them.Arrow: Defines the display style of a reaction arrow (optional)Measure(optional): If set totruethe size of the bounding box of the text is determined returned it as the function result; nothing is drawn in this case.
In addition, the following functions are provided to determine the size of the text bounding box:
function ChemTextExtent(ACanvas: TCanvas; const AText: String; Arrow: TChemArrow = caAsciiSingle): TSizefunction ChemTextHeight(ACanvas: TCanvas; const AText: String; Arrow: TChemArrow = caAsciiSingle): Integerfunction ChemTextWidth(ACanvas: TCanvas; const AText: String; Arrow: TChemArrow = caAsciiSingle): Integer
TPeriodicTable
editUsage
edit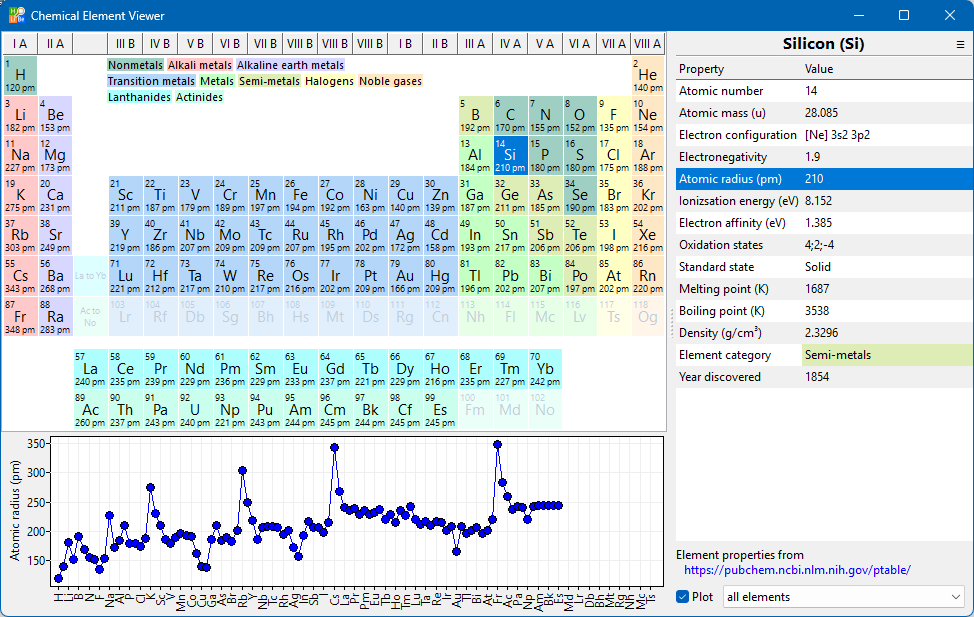
TPeriodicTable is basically a TCustomDrawGrid which specializes on displaying the periodic table of elements.
Element symbol
editEach cell represents an element and lists the element symbol in the center, e.g. 'H', 'He', ... The type for the element symbols is a 2-character string: type TElementSymbol = string[2].
Atomic number
editThe arrangement of the elements is determined by the atomic number, Z, which is shown in the top/left corner of each cell. The type of the atomic numbers is TAtomicNumber = 0..118. Chemically it starts at 1 for hydrogen and increments up to 118 for the currently last known element, Oganesson (Og), but it has been extended by 0 for the case when no element is assigned to a specific grid cell. The method GetZ(ACol, ARow) calculates which element sits in a given grid cell identified by its column and row indexes:
type
  TCustomPeriodicTable = class(TCustomDrawGrid)
  public
    function GetZ(ACol, ARow: Integer): TAtomicNumber;
    ...
Other, normal, functions related to atomic numbers are
function GetElementSymbol(Z: TAtomicNumber): TElementSymbol;
function GetFullElementName(Z: TAtomicNumber): String;
function GetZ(AElementSymbol: String): TAtomicNumber;
They are useful for connecting the atomic number with the chemical symbol and chemical element name.
Element layout
editThe component supports two element layouts within the grid:
- When the property
CompactLayoutisfalsethe f-block with the Lanthanides and Actinides is included in the main body which results in a rather wide grid of 36 columns. - When, on the other hand,
CompactLayoutistruethe f-block is placed below the main body, and the grid width shrinks to 18 columns. This is the default setting.
Group names
editThe names of the chemical element groups (grid columns) can be shown in the grid's header row by means of the GroupNames property (type TPeriodicTableGroupNames). This is an enumeration consisting of the following elements:
gnNone: No group namesgnIUPAC: Following an international naming convention, the groups are numbered numerically from 1 to 18 from the leftmost column (the alkali metals) to the rightmost column (the noble gases).gnMendeleev: The groups are numbered by Roman literals.gnCAS: Roman numbers again, but with 'A' appended in the s- and p-blocks, and 'B' appended for the d-block.
In any case, the f-block groups are ignored in numbering.
Additional element data
editBesides symbol and atomic number, any other data can be displayed in the grid cells as well. These data must be stored in descendants of the TElementData class (which already stores the atomic number of the associated element and which gives access to the element's symbol and full chemical name).
Example:
type
  TMyElementData = class(TElementData)
    AtomicMass    : Double;             // Atomic mass
    constructor Create(AZ: TAtomicNumber; AMass: Double);
  end;

constructor TMyElementData.Create(AZ: TAtomicNumber; AMass: Double);
begin
  inherited Create(AZ);
  AtomicMass := AMass;
end;
These data items must be added to the internal TElementList of the TPeriodicTable by calling the AddElementData method:
  with FPeriodicTable do
  begin
    AddElementData(TMyElementData.Create(1, 1.0080));       // H
    AddElementData(TMyElementData.Create(2, 4.0260));       // He
    ...
  end;
Note that the element data instances are owned by the element list of the PeriodicTable, they must not be destroyed by the user.
Further methods and properties related to these additional data are
type
  TCustomPeriodicTable = class(TCustomDrawGrid)
  public
    procedure AddElementData(AData: TElementData);
    procedure ClearElementData;
    function GetElementInfo(Z: TAtomicNumber; AList: TStrings): Boolean;
    function HasElementData: Boolean;
    procedure UseElementData(AList: TElementList);
    property ElementData[Z: TAtomicNumber]: TElementData read GetElementData;
    ...
  published
    property OnGetElementDataText: TGetElementDataTextEvent read FOnGetElementDataText write FOnGetElementDataText;
    ...
The event OnGetElementDataText is used to tell the grid which text should be displayed for the additional data in the lower part of the cell. In above example, this could be done as follows:
procedure TForm1.GetElementDataTextHandler(Sender: TObject; Z: TAtomicNumber; var AText: String);
var
  elementData: TElementData;
begin
  elementData := FPeriodicTable.ElementData[Z];
  if elementData is TMyElementData then
    AText := FormatFloat('0.0##', TMyElementData(elementData).AtomicMass);
end;
Popup hints
editSince the space in the grid cells is rather limited the additional data can also be displayed as a popup hint appearing when the mouse hovers over an element cell. To achieve this the ShowHint property of the PeriodicTable must be set to true and a handler for the OnGetHint event must be provided. This handler can read all the data assigned to a specific element by means of the GetElementInfo method.
Cell background colors
editDifferent types of information can be encoded in the cell background colors by means of the CellColorMode property:
ccmCategories: The color represents the category of the element,TElementCategory = (ecNonMetal, ecAlkaliMetal, ecAlkalineEarthMetal, ecTransitionMetal, ecMetal, ecSemiMetal, ecHalogen, ecNobleGas, ecLanthanide, ecActinide)ccmBlocks: Here the color identifies the blocks in which elements have similar properties (s-block, p-block, d-block, f-block):TPeriodicTableBlock = (sBlock, pBlock, dBlock, fBlock).ccmData: Elements to which special data have been assigned are highlighted by a specific color, while elements without such data are colored differently.
The meaning of these color codes can be explained by inserting a legend (boolean property ShowColorLegend).
Every color can be changed by means of the Colors property and its subproperties. The color of a specific element can be queried from the CellColor[Z: TAtomicNumber] property of the Periodic Table. Writing to CellColor puts the color into the corresponding section of Colors and thus affects the colors of all other elements having the same classification as the directly changed element.
Sample projects
editThe folder examples of the installation directory contains two demo projects for TPeriodicTable
- periodictable_runtime: Here the
TPeriodicTablecomponent is created at runtime so that installation of the chemctrls_pkg package is not required (it only must have been opened in the package editor once so that the IDE knows where it is). The project allows to play with most of the component's properties to see which effect they have. - ChemicalElementViewer: This is a more complex application which reads additional element data from a file (https://pubchem.ncbi.nlm.nih.gov/ptable/), lists them for the selected element in a grid and plots the selected data item for all elements or along the period or group of the selected element. The introductory screenshot of the PeriodicTable section is taken from this application.