Difference between revisions of "Debugging with Valgrind"
| Line 34: | Line 34: | ||
== Configuration == | == Configuration == | ||
| − | 1- Install valgrind | + | 1- Install valgrind in your system |
Refer to Valgrind resources to install it. | Refer to Valgrind resources to install it. | ||
| − | 2- Compile your program with Valgrind option | + | 2- Compile your program with Valgrind option. Select menu Project -> Project Options |
[[File:valgrind_project_options.png]] | [[File:valgrind_project_options.png]] | ||
| − | 3- Configure Lazarus debugger | + | 3- Configure Lazarus debugger. Select menu Tools -> Options |
[[File:valgrind_tools_options.png]] | [[File:valgrind_tools_options.png]] | ||
| Line 71: | Line 71: | ||
[[File:valgrind_error.png]] | [[File:valgrind_error.png]] | ||
| + | |||
After you close it Lazasarus will position you on a source row where the exception has happened. | After you close it Lazasarus will position you on a source row where the exception has happened. | ||
| Line 80: | Line 81: | ||
| − | Here especially helpful is the section "Block was | + | Here especially helpful is the section "Block was alloc'd at". Select a line where you see your program source, double click and Lazarus will position cursor at a line where the memory in question was allocated. |
| + | |||
| + | == Other suggestions == | ||
| + | |||
| + | Sometimes it can be still unclear if some memory misuse or a leak happened inside RTL or OS binaries. | ||
| + | You can compile RTL with debugging info for Valgrind and without optimization. Please refer to FPC Wiki how to rebuild RTL. | ||
| + | |||
| + | Sometimes Valgrind can generate some false positives, especially if a small block of memory (less than alignment size) was allocated in stack. Valgrind may decide that it was not fully initialized. Technically yes, with 1 byte variable, only 1 byte is initialized, and the rest bytes of alignment can be not initialized. We do not mind because we never use it. But Valgrind accounts even for this. | ||
| + | You can suppress reporting for such false positives and for other issues in OS or 3-rd party binaries like GTK, X etc, to concentrate more on your code. Please refer to Valgrind documentation regarding suppressions. | ||
Revision as of 05:45, 4 March 2020
│
English (en) │
!!!WORK IN PROGRESS!!!
Introduction
Valgrind is an instrumentation framework for building dynamic analysis tools. There are Valgrind tools that can automatically detect many memory management and threading bugs, and profile your programs in detail. You can read about Valgrind here https://valgrind.org/
A program running under Valgrind is not executed directly by the CPU. Instead it runs on a synthetic CPU provided by Valgrind.
The debugging applications stack is following:
- GDB
- VGDB
- Valgrind executing YourProgram
Though GDB can connect to VGDB directly (process - to - process), Lazarus cannot use this mode. You have to use Remote debugging. In this setup VGDB plays role of GDBServer listening on a TCP port, and Lazarus via GDB connects to it.
So the debugging applications stack with Lazarus will be:
- Lazarus IDE
- GDB
- tcp/ip
- VGDB
- Valgrind executing YourProgram
Usually you will run all parts on same computer. But there is possibility to run them on 2 computers via network.
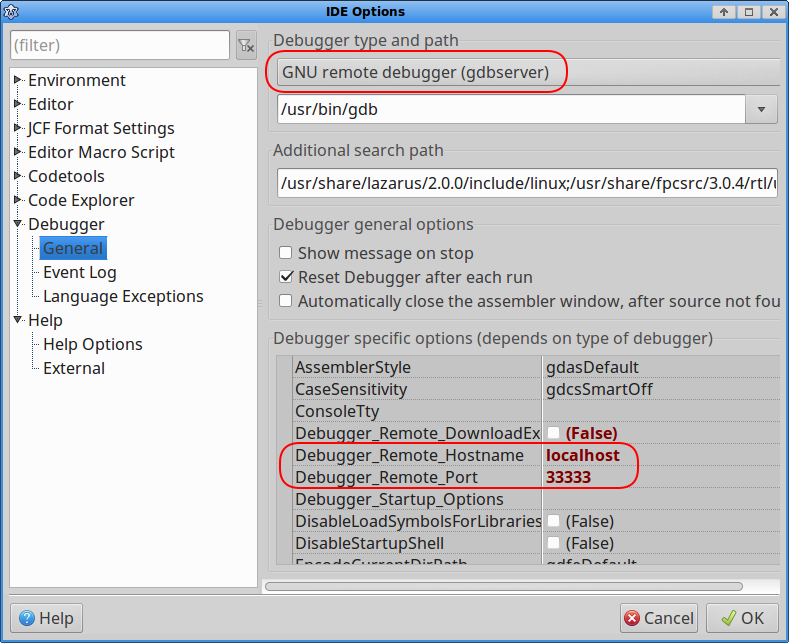
In the following example everything will be on same computer. Network interface will be localhost and TCP port will be 333333.
Configuration
1- Install valgrind in your system Refer to Valgrind resources to install it.
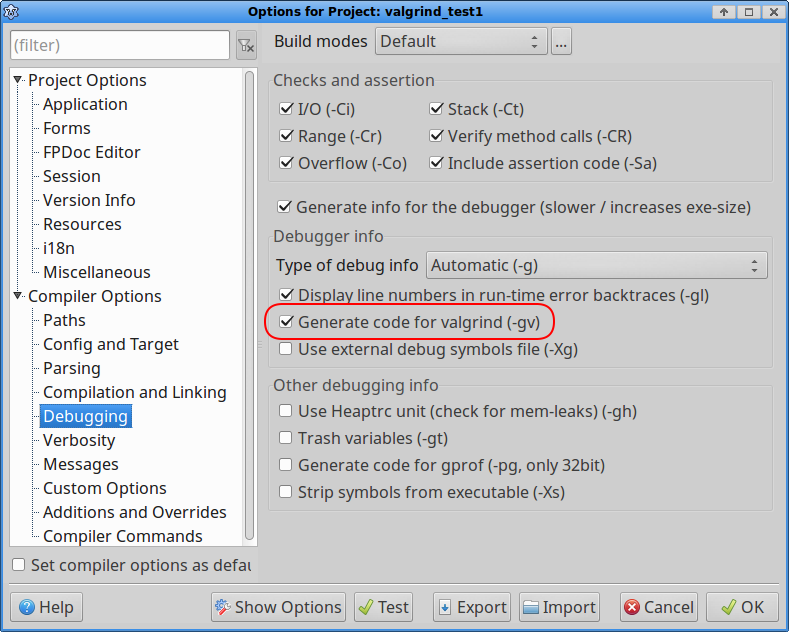
2- Compile your program with Valgrind option. Select menu Project -> Project Options

3- Configure Lazarus debugger. Select menu Tools -> Options

4- Start Valgrind and VGDB in a separate shell
valgrind --tool=memcheck --leak-check=yes --log-file=valgrind.trc --vgdb-error=0 ./myprogram &
sleep 2; vgdb --port=33333
5- Run your program in Lazarus
Lazarus via VGDB communicates with the program in Valgrind. You can set breakpoints, inspect variable values and so on, like in regular debugger. Also Lasarus will stop on lines where Valgrind throws exceptions. Valgrind tracks memory usage very carefully and issues exceptions where FPC, RTL and a memory manager may ignore memory misuse. Like at line 4 below.
  mo:=TMyObj.Create;
  mo.Field:=12345;
  mo.Free;
  if mo.Field = 0 // Mistakenly accessing released memory block
  then exit;
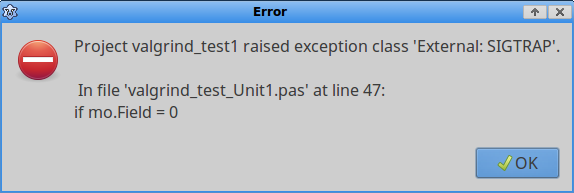
Please note Valgrind is accurate but it is not a fastest debugger. Be patient. When Valgrind issues an exeption Lazarus will show a message.
After you close it Lazasarus will position you on a source row where the exception has happened.
Lazarus provides with very basic information on what exacly happened. Valgrind gives you much more details.
To get more details you can either look into Valgrind trace file. But more convenient is to load the trace file into IDE. Select menu View -> Leaks and Traces
Open valgrind.trc
Here especially helpful is the section "Block was alloc'd at". Select a line where you see your program source, double click and Lazarus will position cursor at a line where the memory in question was allocated.
Other suggestions
Sometimes it can be still unclear if some memory misuse or a leak happened inside RTL or OS binaries. You can compile RTL with debugging info for Valgrind and without optimization. Please refer to FPC Wiki how to rebuild RTL.
Sometimes Valgrind can generate some false positives, especially if a small block of memory (less than alignment size) was allocated in stack. Valgrind may decide that it was not fully initialized. Technically yes, with 1 byte variable, only 1 byte is initialized, and the rest bytes of alignment can be not initialized. We do not mind because we never use it. But Valgrind accounts even for this. You can suppress reporting for such false positives and for other issues in OS or 3-rd party binaries like GTK, X etc, to concentrate more on your code. Please refer to Valgrind documentation regarding suppressions.

