Uploads by Wp
From Free Pascal wiki
Jump to navigationJump to searchThis special page shows all uploaded files.
| Date | Name | Thumbnail | Size | Description | Versions |
|---|---|---|---|---|---|
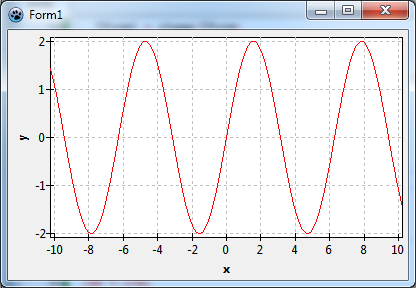
| 23:39, 24 September 2012 | FuncSeries5.png (file) |  |
18 KB | 2 | |
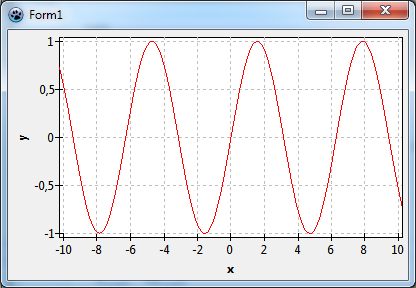
| 23:32, 24 September 2012 | FuncSeries3.png (file) |  |
17 KB | 2 | |
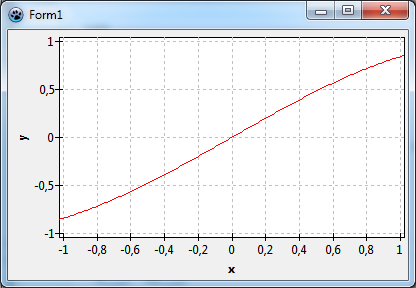
| 23:30, 24 September 2012 | FuncSeries2.png (file) |  |
17 KB | 4 | |
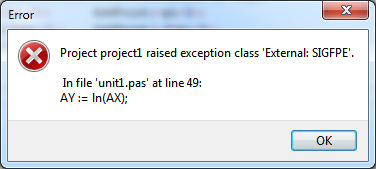
| 00:49, 24 September 2012 | FuncSeries8.png (file) |  |
16 KB | Runtime error when using the log function without domain exclusions | 1 |
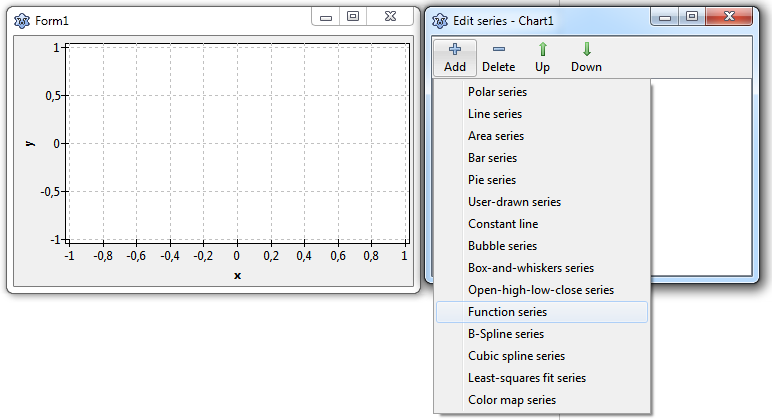
| 23:01, 23 September 2012 | FuncSeries1.png (file) |  |
27 KB | 3 | |
| 20:22, 5 September 2012 | TAChart DualYAxis11.png (file) |  |
34 KB | Legend reverted as in tutorial | 3 |
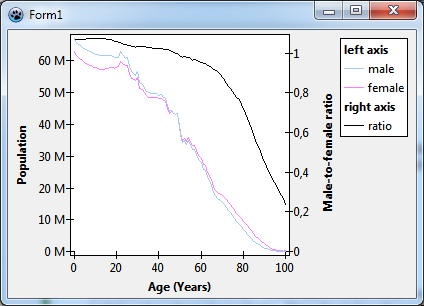
| 18:50, 5 September 2012 | TAChart DualYAxis10.png (file) |  |
23 KB | Legend with group titles | 1 |
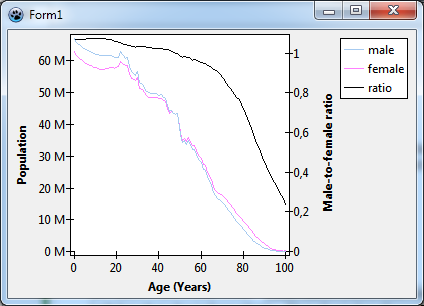
| 18:35, 5 September 2012 | TAChart DualYAxis9.png (file) |  |
23 KB | with legend | 1 |
| 18:29, 5 September 2012 | TAChart DualYAxis8.png (file) |  |
22 KB | Almost finished | 1 |
| 17:39, 5 September 2012 | TAChart DualYAxis7.png (file) |  |
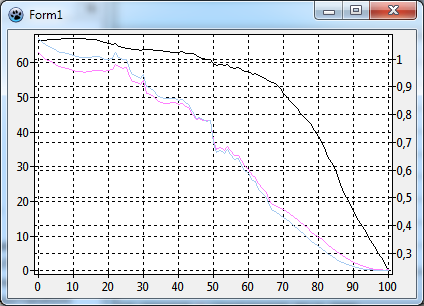
26 KB | Test run after having added AutoScaleAxisTransforms | 1 |
| 17:38, 5 September 2012 | TAChart DualYAxis6.png (file) |  |
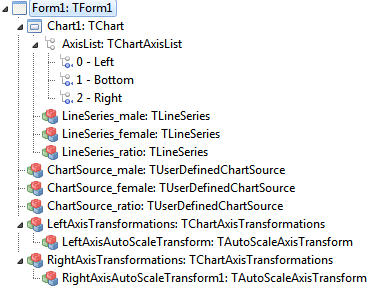
7 KB | Object tree with AutoScaleAxisTransforms | 1 |
| 17:18, 5 September 2012 | TAChart DualYAxis4.png (file) |  |
2 KB | Object tree after having added a 2nd y axis | 1 |
| 17:17, 5 September 2012 | TAChart DualYAxis5.png (file) |  |
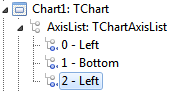
26 KB | Right axis not yet working as it should | 1 |
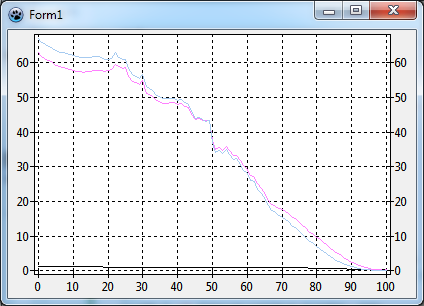
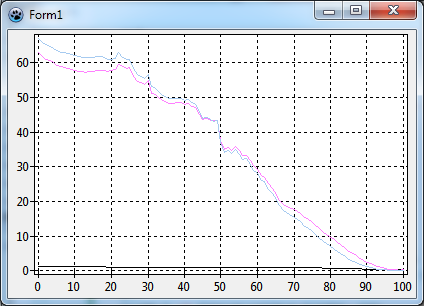
| 17:02, 5 September 2012 | TAChart DualYAxis3.png (file) |  |
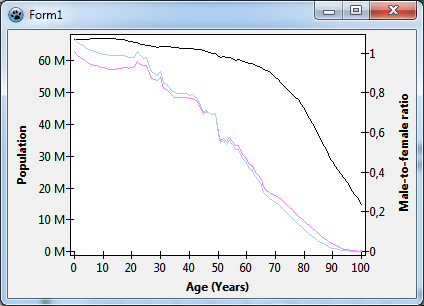
27 KB | Plot of male and female population, and male-to-female population ratio vs age - runtime | 1 |
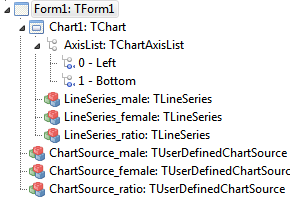
| 17:02, 5 September 2012 | TAChart DualYAxis2.png (file) |  |
5 KB | Plot of male and female population, and male-to-female population ratio vs age - object tree | 1 |
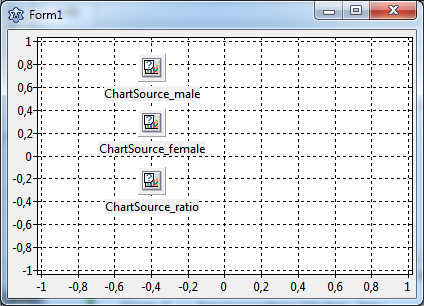
| 17:01, 5 September 2012 | TAChart DualYAxis1.png (file) |  |
26 KB | Plot of male and female population, and male-to-female population ratio vs age - form in design mode | 1 |
| 22:54, 16 August 2012 | TAChart LogAx Tutorial14.png (file) |  |
21 KB | Reverted to version as of 12:36, 11 August 2012 | 3 |
| 19:08, 15 August 2012 | TAChart Population3.png (file) |  |
277 bytes | 1 | |
| 00:34, 15 August 2012 | TAChart LogAx Tutorial7.png (file) |  |
14 KB | 2 | |
| 23:23, 14 August 2012 | TAChart LogAx Tutorial17.png (file) |  |
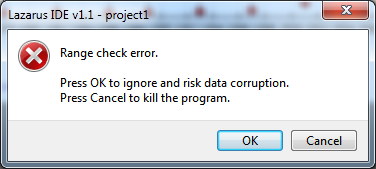
28 KB | Range check error after connecting the ChartTransformations component to the Chart.Transformations | 1 |
| 22:15, 14 August 2012 | TAChart LogAx Tutorial2.png (file) |  |
261 bytes | 12 | |
| 21:52, 14 August 2012 | TAChart LogAx Tutorial16.png (file) |  |
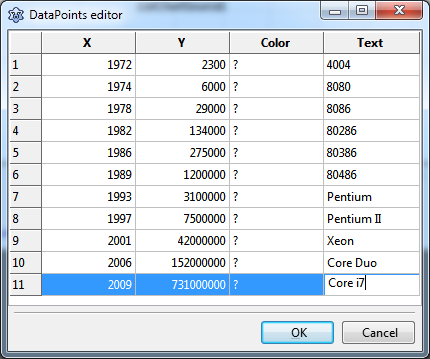
23 KB | Data entered into the grid-based datapoint editor of TListChartSource | 1 |
| 22:34, 12 August 2012 | TAChart Population7.png (file) |  |
5 KB | Moving the x axis in front of the y axis to get the drawing order correct | 1 |
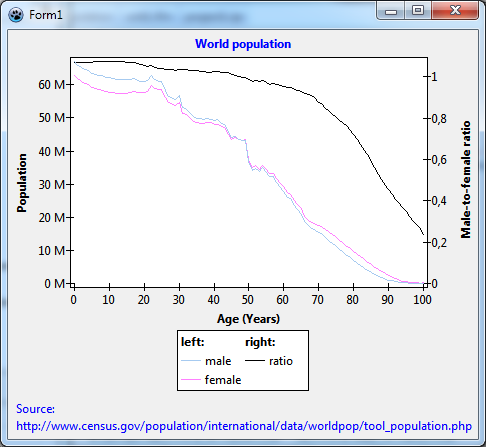
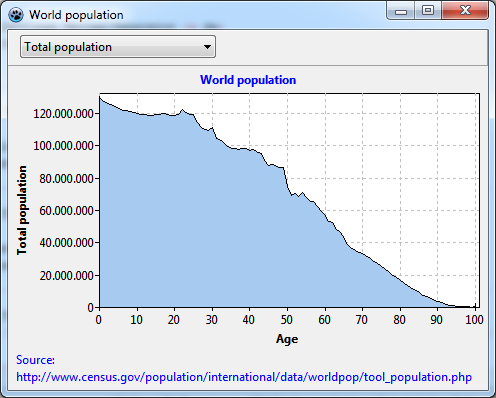
| 21:12, 12 August 2012 | TAChart Population6.png (file) |  |
26 KB | Finished chart of population data | 1 |
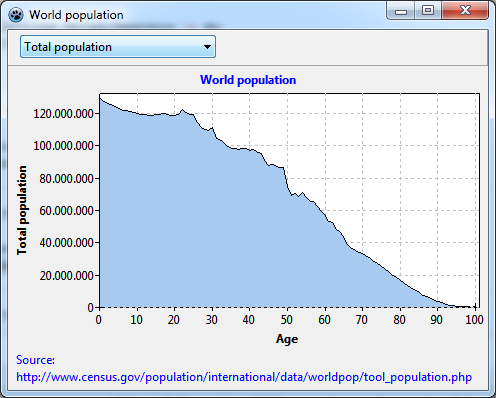
| 20:56, 12 August 2012 | TAChart Population5.png (file) |  |
26 KB | Chart with population data: minor flaw at x axis | 1 |
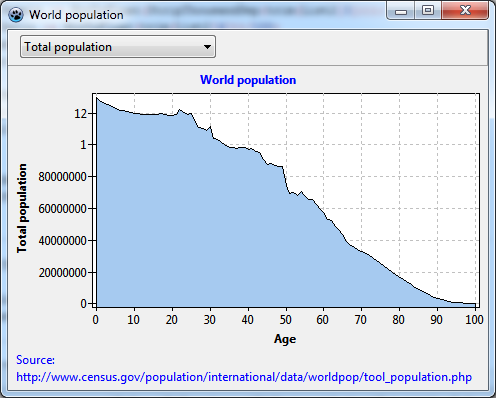
| 20:03, 12 August 2012 | TAChart Population4.png (file) |  |
35 KB | Chart with population area series - 1st run | 1 |
| 19:23, 12 August 2012 | TAChart Population2.png (file) |  |
28 KB | Empty chart prepared for displaying population data | 1 |
| 19:01, 12 August 2012 | TAChart - Population1.png (file) |  |
31 KB | Screenshot of our data source (http://www.census.gov) | 1 |
| 14:52, 11 August 2012 | TAChart LogAx Tutorial15.png (file) |  |
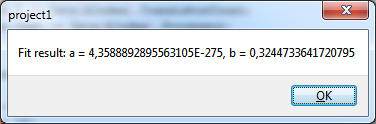
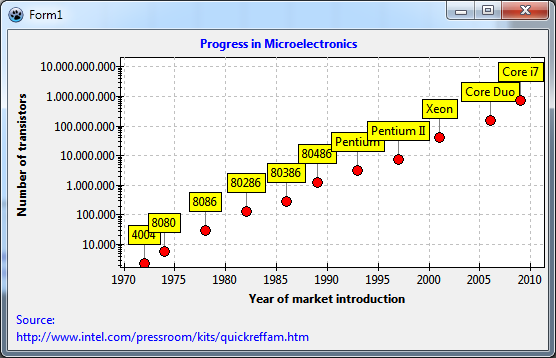
41 KB | Final chart with fitting result. | 1 |
| 14:28, 11 August 2012 | TAChart LogAx Tutorial13.png (file) |  |
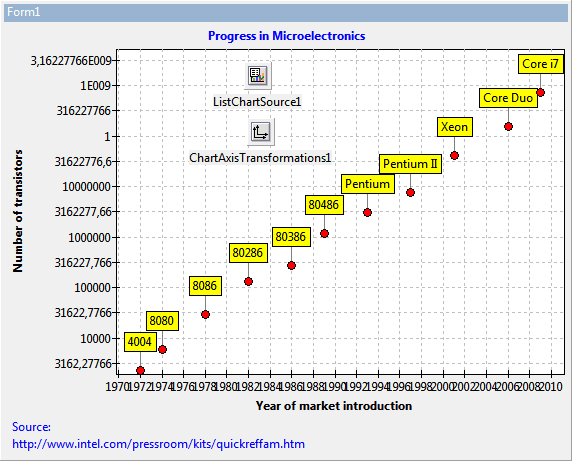
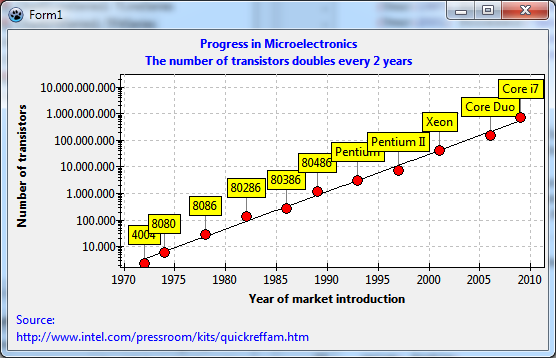
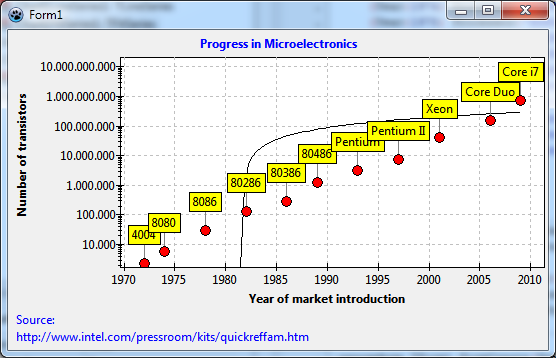
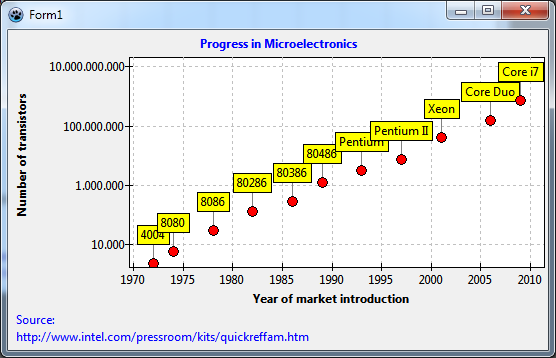
41 KB | Microprocessor data with fitted exponential law y = a exp(b x) | 1 |
| 14:21, 11 August 2012 | TAChart LogAx Tutorial12.png (file) |  |
41 KB | Microprocessor data and fitted linear law y = a + bx | 1 |
| 13:33, 11 August 2012 | TAChart LogAx Tutorial11.png (file) |  |
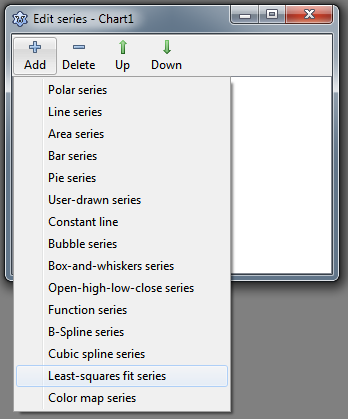
21 KB | Adding a TFitSeries to the chart | 1 |
| 01:09, 11 August 2012 | TAChart LogAx Tutorial10.png (file) |  |
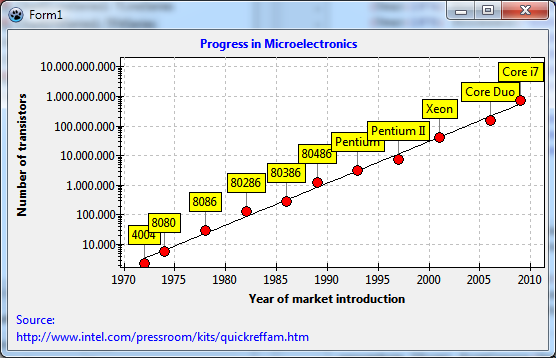
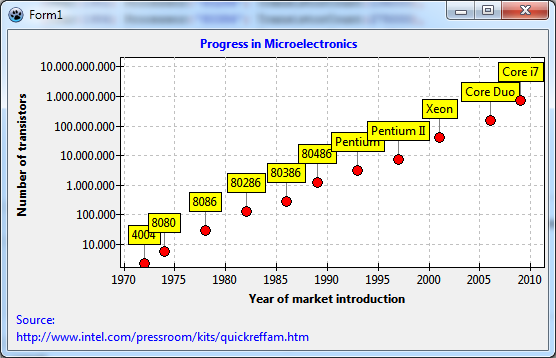
22 KB | Chart of microprocessor data completed | 1 |
| 01:01, 11 August 2012 | TAChart LogAx Tutorial9.png (file) |  |
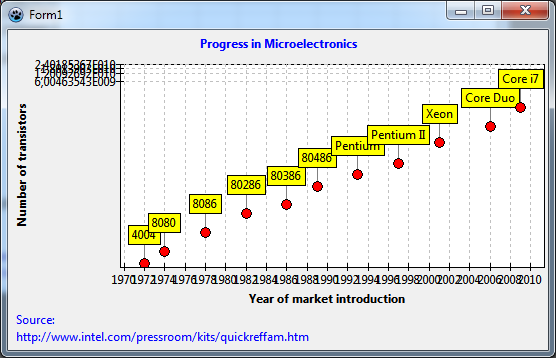
34 KB | Chart after manual axis labelling using a ListChartSource | 1 |
| 00:36, 11 August 2012 | TAChart LogAx Tutorial8.png (file) |  |
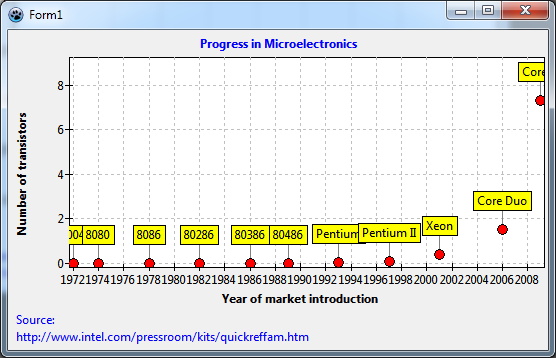
24 KB | Axis labels fixed | 1 |
| 00:14, 11 August 2012 | TAChart LogAx Tutorial6.png (file) |  |
29 KB | Logarithmic chart of transistor data, initial result | 2 |
| 00:10, 11 August 2012 | TAChart LogAx Tutorial3.png (file) |  |
24 KB | First chart of microprocessor data | 5 |
| 23:40, 10 August 2012 | TAChart LogAx Tutorial1.png (file) |  |
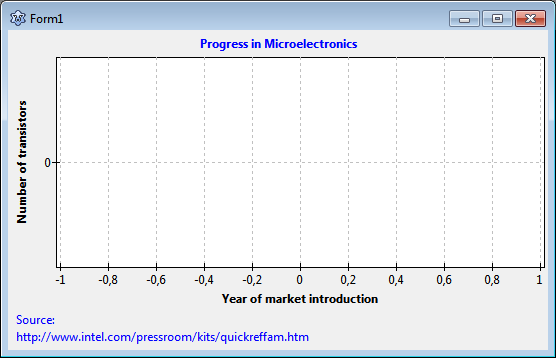
8 KB | Empty chart with labelled axes, title and footer | 2 |
| 22:49, 10 August 2012 | TAChart LogAx Tutorial5.png (file) |  |
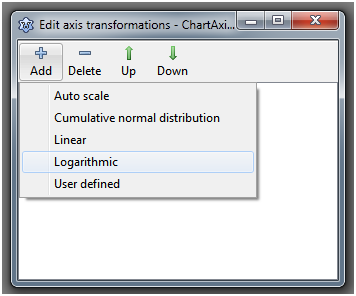
19 KB | Creating a ChartAxisTransform | 1 |
| 22:46, 10 August 2012 | TAChart LogAx Tutorial4.png (file) |  |
202 bytes | Palette icon of TChartAxisTransformations | 1 |
| 21:52, 3 August 2012 | tachart getting started step6.png (file) |  |
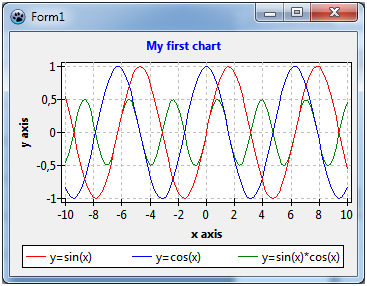
25 KB | Completed chart with three series, legend, axis titles and chart title | 1 |
| 21:48, 3 August 2012 | tachart getting started step5.png (file) |  |
25 KB | Chart with three line series an legend underneath the chart | 1 |
| 21:43, 3 August 2012 | tachart getting started step4a.png (file) |  |
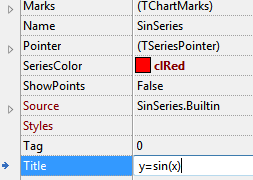
3 KB | Change the title of a series | 1 |
| 21:42, 3 August 2012 | tachart getting started step4.png (file) |  |
21 KB | Chart with three line series and legend | 1 |
| 21:34, 3 August 2012 | tachart getting started step3.png (file) |  |
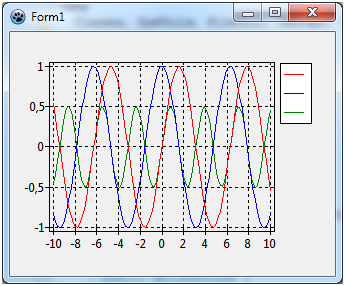
25 KB | Chart with three series and legend, series are still untitled. | 1 |
| 21:21, 3 August 2012 | tachart getting started step2.png (file) |  |
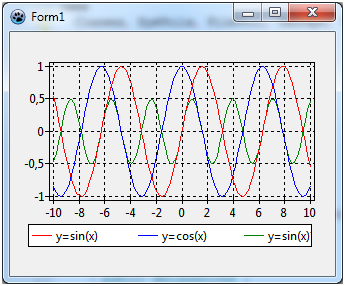
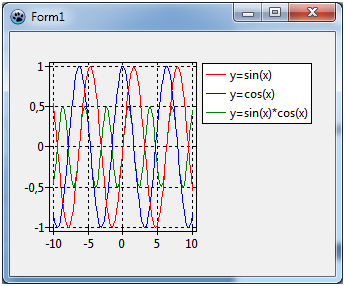
24 KB | Chart with three line series populated by sin, cos and sin*cos functions | 1 |
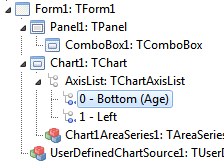
| 21:04, 3 August 2012 | tachart getting started object tree.png (file) |  |
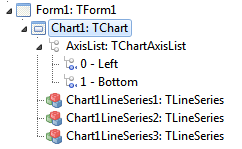
4 KB | TAChart object tree showing a chart and three series | 1 |
| 21:01, 3 August 2012 | TAChart GettingStarted Step1a.png (file) |  |
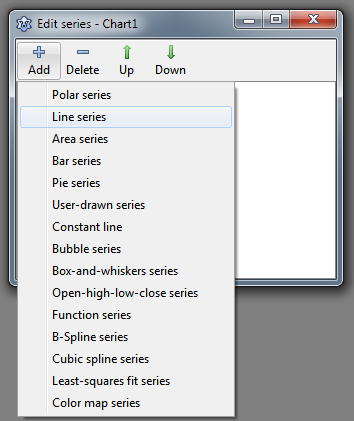
22 KB | A new series can be added to a chart by using the TAChart series editor. | 1 |
| 20:54, 3 August 2012 | TAChart GettingStarted Step1.png (file) |  |
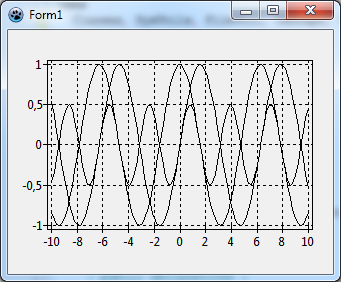
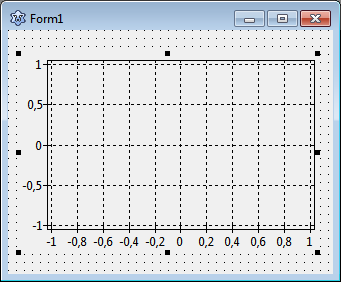
5 KB | new form with an empty TAChart component | 1 |
| 20:50, 3 August 2012 | TAChart component palette.png (file) | 3 KB | 1 |