Difference between revisions of "TAChart Tutorial: ColorMapSeries, Zooming"
m (→Zoom history) |
|||
| Line 185: | Line 185: | ||
[[file:Mandelbrot_Zooming.png]] [[file:Mandelbrot_ZoomingResult.png]] [[file:Mandelbrot_DeepZoom.png]] | [[file:Mandelbrot_Zooming.png]] [[file:Mandelbrot_ZoomingResult.png]] [[file:Mandelbrot_DeepZoom.png]] | ||
| − | Of course, you can use the new magnified image to zoom again and again. However, at some zoom level, the axis labels will get longer and longer and may eventually overlap. This does not look nice. Do we need the | + | Of course, you can use the new magnified image to zoom again and again. However, at some zoom level, the axis labels will get longer and longer and may eventually overlap. This does not look nice. Do we need the axes at all? No -- let's turn them off by going to the left and the bottom axis and setting their property <code>Visible</code> to <code>false</code>. But maybe we should have some indication on the size of the current viewport. We could display the current magnification in the statusline. |
Drop a statusline component to the form -- it is on page ''Common Controls'' of the component palette. Since we will add more items later, go to property <code>Panels</code> and add two status panels, set their width to 200. | Drop a statusline component to the form -- it is on page ''Common Controls'' of the component palette. Since we will add more items later, go to property <code>Panels</code> and add two status panels, set their width to 200. | ||
Revision as of 20:59, 26 October 2012
Introduction

The "Mandelbrot set", named after Benoit Mandelbrot, is a so-called "fractal" -- a two-dimensional shape that is famous for its self-similarity at various scales. Magnifying a fractal reveals small-scale details similar to the large-scale characteristics.
In this tutorial, we will use TAChart to draw the Mandelbrot set by means of a colormap series and practice a variety of zooming techniques, like using the zoom drag tool, or setting up an extent history.
As usual, we require a basic knowledge of working with TAChart which you can aquire by going through the "Getting Started" tutorial. And, of course, you must be familiar with the Lazarus IDE and the Object Pascal language.
Using TColormapSeries
What is a TColorMapSeries?
The series that you typically work with are for two-dimensional data -- there is one axis for the x coordinates, and another one for the y values which are assigned to the x values. TColorMapSeries is one exception: it displays three-dimensional data: we have a point in the xy plane and assign to it a third value as its height above the xy plane. Often, 3D plots, are considered to be like a mountain landscape above a base plane. Unfortunately, TAChart cannot draw 3D projections. But there is an alternative: the height above the base plane can be can be mapped to a color, this means the chart fills the xy plane with colors which correspnd to the value of the third coordinate.
TColorMapSeries is a functional series, this means that it cannot plot arbitrary data, but only data that can be calculated from a function. For this purpose, the series exposes an event OnCalculate which is called for every (x,y) point to pass the function value. In this sense, the TColorMapSeries is similar to the TFuncSeries which we meet in another tutorial.
The second basic ingredient is a ColorSource which maps the function values to a color. It is convenient to use a TListChartSource for this purpose. In general, it stores x and y values along with a color value and a descriptive label in TChartDataItems, but for the mapping purpose we need only the x and color entries.
Ready to start?
Create a new project, and add a client-aligned TChart component. Don't make the window too large since the project in this tutorial will require a LOT of computation, and too many pixels will kill performance...
Double-click on the chart to open the series editor and add a "Color map series" to the chart. Next, drop a TListChartSource to the form. This will be the ColorSource for the ColorMapSeries. So, name it "ColorSource" and assign it to the ColorSource property of the series.

Setting up the color map
To get some familiarity in this new terrain, let us begin with a simple example: we use the ColorMapSeries to draw a gradient along the x axis.
At first, we write an event handler for the ColorMapSeries' OnCalculate. This is easy since we want only a simple linear gradient:
procedure TForm1.Chart1ColorMapSeries1Calculate(const AX, AY: Double;
  out AZ: Double);
var
  ext: TDoubleRect;
begin
  ext := Chart1.GetFullExtent;
  AZ := (AX - ext.a.x) /(ext.b.x - ext.a.x);
end;
To be independent of the size of the chart we normalize the x coordinate by the range of x data (in graph units). The x range can be calculated from the FullExtent of the chart -- this is a rectangle of double-precision values defined by the corner points of the chart's plotting rectangle before any zooming or panning is applied. The normalization as shown above makes sure that AZ is 0 at the left and 1 at the right end of the x axis.
Finally we have to populate the ColorSource to setup the gradient. This is very easy since the ColorMapSeries does all the interpolations if its property Interpolate is set to true.
To define the gradient we begin with the value 0.0 and assign it to the color blue. The end of the gradient corresponds to the value 1.0 and it should appear in yellow. We make these assignments in a procedure PopulateColorSource that we call from the OnCreate event handler of the form; we use a separate procedure since we'll do some modifications throughout this tutorial and want to keep things separate.
procedure TForm1.FormCreate(Sender: TObject);
begin
  PopulateColorSource;
end;

procedure TForm1.PopulateColorSource;
const
  DUMMY = 0.0;
begin
  with ColorSource do begin
    Add(0.0, DUMMY, '', clBlue);      // 0.0 --> blue
    Add(1.0, DUMMY, '', clYellow);    // 1.0 --> yellow
  end;
end;
Due to the syntax of TListChartSource.Add we also have to enter values for the y coordinate and the marks text, we use the constant DUMMY and an empty string since we don't need them.
Let's run the program. If you don't see a gradient you may have forgotten to activate the Interpolate setting of the ColorMapSource. If you look carefully you will see some narrow banding of the color shades particularly in the center transition region. This is due to the StepX and StepY properties of the ColorMapSource which are still at their default value of 4. This means that the xy plane is not scanned pixel by pixel, but in blocks of 4x4 pixels, to speed up drawing. Set these values to 1 to get rid of the banding. The improved resolution is also advantageous for the Mandelbrot set later. However, it will slow down program execution which may be quite dramatic if you have a slow computer...


Let's go a step further and add another pivot to our gradient. What about red in the middle corresponding to, say, 0.3? Just put another call to Add into the PopulateColorSource procedure. Since the interpolation requires a sorted list you should add the new color between the other ones, or you should call Sort after adding color-value pairs. The result of this tree-color gradient is shown above, we will used it now when we draw the Mandelbrot set.
procedure TForm1.PopulateColorSource;
const
  DUMMY = 0.0;
begin
  with ColorSource do begin
    Add(0.0, DUMMY, '', clBlue);      // 0.0 --> blue
    Add(0.3, DUMMY, '', clRed);       // 0.3 --> red
    Add(1.0, DUMMY, '', clYellow);    // 1.0 --> yellow
  end;
end;
The Mandelbrot set
So what is the Mandelbrot set? Roughly speaking, it is a set of points in the xy plane that follow a certain rule, like a circle which has the rule that all points on the circle (i.e. in the set) must have the same distance from the origin.
For the Mandelbrot set the rule is a bit more complex. The world "complex" is to be understood here in a two-fold sense: complex in the sense of "complicated", but also complex in the mathematical sense that the points in the xy plane are treated as complex numbers. If you are not familiar with complex numbers, don't give up -- we will avoid calculations with these "strange" numbers completely.
Calculation
The best way to understand the Mandelbrot set is do its construction. We apply the following recipe for each 2d point in the xy plane; these starting points will be called c = (cx, cy).
- Begin by assigning c to another point z = (zx, zy) = (cx, cy).
- Calculate the "square" of z according to the following formula: z2 = (zx2 - zy2, 2 * zx * zy) -- this formula may appear a bit strange, but if you are familiar with complex numbers then you will notice that it is the way how to calculate the square of a complex number.
- Then add the coordinates of c to those of
z2. The result of this step is z2 + c = (zx2 - zy2 + cx, 2 * zx * zy + cy) - Now take that result and put it into the calculation in step 2 again as a new value of z.
- Repeat this procedure again and again. As a result the point z will follow some kind of trajectory in the xy plane. In the figure we show some examples of that trace:
- The red and fuchsia curves eventually move away from the origin, these paths are "unbounded". It can be shown that once the path has crossed a critical distance of 2 from the origin it will never return back and will escape into infinity. Usually the calculation counts the iterations until the distance from the origin exceeds 2. The number of iterations is mapped to a color which is used to draw the pixel at the starting point c.
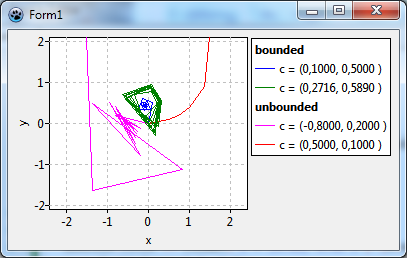
- The blue path, on the other hand, converges towards the origin. The green curve does not converge, but remains within the escape radius. Both cases are called "bounded". The iterative calculation would go on forever. Therefore it is stopped after a maximum count of iterations. The starting points c for these trajectories are said to belong to the Mandelbrot set and are drawn in black color.

Although this description may sound a bit complicated only a few lines of Pascal code are required to do this calculation. The following function determines whether a point c is in the Mandelbrot set or not. It returns the number of iterations needed and the coordinates of the point after the last iteration performed.
const
  MANDELBROT_NUM_ITERATIONS = 100;
  MANDELBROT_ESCAPE_RADIUS = 2.0;
  MANDELBROT_LIMIT = sqr(MANDELBROT_ESCAPE_RADIUS);

function InMandelbrotSet(c:TDoublePoint; out Iterations:Integer; out z: TDoublePoint): Boolean;
var
  j: Integer;
begin
  Iterations := 0;
  z := DoublePoint(0.0, 0.0);
  for j:=0 to MANDELBROT_NUM_ITERATIONS-1 do begin
    z := DoublePoint(
      sqr(z.X) - sqr(z.Y) + c.X,
      2 * z.X * z.Y + c.Y
    );
    if sqr(z.X) + sqr(z.Y) > MANDELBROT_LIMIT then begin
      Result := false;
      // point did escape --> c is not in Mandelbrot set
      exit;
    end;
    inc(Iterations);
  end;
  Result := true;
end;
Drawing
Now we want to draw the Mandelbrot set. You know what to do? Yes - we have to write a corresponding handler for OnCalculate. In this event handler we call our InMandelbrotSet procedure. If the point passed to the event handler is in the Mandelbrot set we set its color to black, if not we divide the number of iterations by the maximum number of iterations to get a value between 0 and 1 which has a corresponding entry in our ColorSource. Oh - but how can we give the points in the Mandelbrot set a black color? Just add another number-color pair to the ColorSource which links clBlack to, e.g., -1.
procedure TForm1.PopulateColorSource;
const
  DUMMY = 0.0;
begin
  with ColorSource do begin
    Clear;
    Add(-1.0, DUMMY, '', clBlack);
    Add( 0.0, DUMMY, '', clBlue);
    Add( 0.3, DUMMY, '', clRed);
    Add( 1.0, DUMMY, '', clYellow);
  end;
end;

procedure TForm1.Chart1ColorMapSeries1Calculate(const AX, AY: Double;
  out AZ: Double);
var
  iterations: Integer;
  z: TDoublePoint;
begin
  if InMandelBrotSet(DoublePoint(AX, AY), iterations, z) then
    AZ := -1
  else
    AZ := iterations / MANDELBROT_NUM_ITERATIONS;
end;
And that's what we get - see the left image:


Very nice. But as usual the first result is not yet the best one. These are two points that we can improve:
- The picture is clipped. This is because we did not define the calculation range that the ColorMapSeries occupies for x and y. The overview of the Mandelbrot set is seen best when x and y range between -2.2 and 0.8, and between -1.5 and 1.5, respectively. Enter these numbers in the chart's
ExtentfieldsXMin, XMax, YMinandYMax, and set the fieldsUseXMin, UseXMax, UseYMinandUseYMintotrueto activate these values as axis limits. You might as well use theExtentproperty of the series, but then you would have to set the chart'sMarginsto 0 in order to remove the non-filled background near the axes.
- The picture looks somehow distorted if you compare it with the images in [1]. This happens because x and y axes have different unit lengths. To avoid the distortion the distance between 0 and 1 must be equal for both axes. Of course, we could initialize the width and height of the form correctly, but the user could resize the form, and this would distort our image again. However,
TCharthas a practical property to enforce a "square" coordinate system: setProportionaltotrue. With this setting the extent of the x and y axes is adjusted automatically to always get equal units.
The result after these modifications is displayed above in the right image. You maybe notice that the x axis range is wider than we had requested. This is a consequence of the Proportional setting since the aspect ratio of our window is not compatible with the x and y ranges set in the chart's Extent.
Before we continue with the tutorial, here's a piece of "homework": Modify the program such that the Mandelbrot set is not black, but shows colors according to the distance of the trajectory from the origin when the iteration is aborted.
Zooming and panning
It was mentioned in the introduction that the Mandelbrot set is self-similar at magnified scales. This calls for zooming -- and this will be the subject of the next part of the tutorial.
Built-in zooming and unzooming
TChart has built-in zooming capabilities. You just have to drag a rectangle with the mouse from the top-left to the bottom-right corner of the region that you want to magnify and hold the left mouse button down while dragging. To restore the old viewport drag in any other direction, or just click into the image.


Of course, you can use the new magnified image to zoom again and again. However, at some zoom level, the axis labels will get longer and longer and may eventually overlap. This does not look nice. Do we need the axes at all? No -- let's turn them off by going to the left and the bottom axis and setting their property Visible to false. But maybe we should have some indication on the size of the current viewport. We could display the current magnification in the statusline.
Drop a statusline component to the form -- it is on page Common Controls of the component palette. Since we will add more items later, go to property Panels and add two status panels, set their width to 200.
Extents
How do we get the current magnification? The viewport is described in TAChart by several "extents"; these are rectangles like TRect, but the corner points are given by floating point numbers (in graph coordinates). This data type is called TDoubleRect and is declared in unit TAChartUtils. We already had discussed the function GetFullExtent of TChart which returns the unzoomed/unpanned viewport. After zooming or panning the visible viewport can be accessed by CurrentExtent and LogicalExtent. Both rectangles are very similar, the former one is slightly larger than the latter one since it also takes care of the space needed for the axis tick marks and the inner chart margins. Because this extra space is not considered in the full extent, we have to compare the widths of the full extent to that of the logical extent to calculate the magnification.
It should be noted that the extents are always given in graph units, i.e. the underlying coordinate system of the chart. In our case this is the same as the coordinate system displayed at the axes (axes coordinates), but if our chart would take advantage of TChartTransformations we would have to consider this important difference.
When do we update the status bar? Whenever the extent of the chart changes. TChart provides two events for this occasion: OnExtentChanged and OnExtentChanging. Both events are fired when the extent already has changed, OnExtentChanged is called from within the drawing routine, OnExtentChanging is called before any drawing. The difference is important if your event handler would initiate a re-draw of the chart again -- this might lock your application... In our application the difference is not important, so we'll vote against OnExtentChanging which is not yet available in the official Lazarus version.
procedure TForm1.Chart1ExtentChanged(ASender: TChart);
var
  cex, fex: TDoubleRect;
  factor: double;
begin
  cex := Chart1.CurrentExtent;
  fex := Chart1.GetFullExtent;
  if cex.b.x = cex.a.x then exit;

  factor := (fex.b.x - fex.a.x) / (cex.b.x - cex.a.x);
  if factor > 1e6 then
    Statusbar1.Panels[0].Text := Format('Magnification: %.0e', [factor])
  else
    Statusbar1.Panels[0].Text := Format('Magnification: %0.n', [factor]);
end;
This is a possible version of the event handler. Since very large magnification factors will be difficult to read we switch to exponential numeric notation above 1 million.
Zooming towards infinity...
Play with the magnifications -- the image on the right is magnified by almost 1 billion times (1E9). And when you are lucky you'll find locations where you can zoom to magnifications of 1E14 before the image gets ugly. Hold on for a moment and think about this number: if the original, non-zoomed window is 10 cm across -- then it would measure 1E13 meters at this magnification. This is the size of the solar system! It does not make sense to zoom any further because we reached the limit of double precision number used by TAChart internally. However, theoretically, it could go on and on and on...
Using ChartTools
Maybe you want to shift the viewport a bit to the left or right at the same magnification. This operation is called panning. In the trunk version of Lazarus, you can pan the image by dragging it with the right mouse button. In the release version there is not built-in panning support. But you can achieve panning by of the so-called ChartTools. Most of all, these tools are important because they give better control of the zooming and panning process.
We will not go into details of what ChartTools are and what they can do in general. Refer to another tutorial for an introduction if they are not familiar to you.
To begin with, add a ChartToolSet component to the form and link it to the property Toolset of the chart. Then double-click on the toolset and add a Zoom by drag and a Panning by drag tool -- we need the ZoomDragTool also because default zooming is disabled when a toolset is used. Select the ZoomDragTool in the object inspector -- it is a child of the ChartToolset in the object tree -- and set its property Shift to ssLeft. This is the mouse button to activate the zoom tool, i.e. the ZoomDragTool will work in the same way as the built-in zooming tool. Repeat the same with the PanDragTool, but now assign ssRight to the Shift property. If you want you can combine it with other keys, like CTRL.
If you run the program now you can pan even if you have the official Lazarus version.
Zoom history
For those who use the trunk version we can add another gadget, a zoom history (users of the official version are out of luck, they must skip this section - sorry...).
If you zoom deeper and deeper into the Mandelbrot set you may want to go one or more steps back to investigate details that are no longer visible at the current zoom level. The zoom history stores all the extents that once were active during the entire zooming and panning process.
The units TATypes and TAChartUtils provide a class TAChartExtentHistory which allows to implement a zoom history. Since this is not a component it must be used by code. We create and destroy it in the FormCreate and FormDestroy events as the zoom history is needed throughout the entire program:
procedure TForm1.FormCreate(Sender: TObject);
begin
  PopulateColorSource;
  Chart1ColorMapseries1.ColorSource := ColorSource;
  // this is new:
  ZoomHistory := TChartExtentHistory.Create;
  ZoomHistory.Capacity := 100;
  // our history can capture 100 items until the oldest item is dropped.
end;

procedure TForm1.FormDestroy(Sender: TObject);
begin
  ZoomHistory.Free;
end;
Whenever zooming or panning events occur the visible viewport of the chart must be added to the history. For simplicity, we use the AfterMouseUp events of the ZoomDragTool and the PanDragTool for this purpose. We could also use the more general OnExtentChanged event of the chart, but here we have to be careful to skip the extent changes caused by unzooming -- please study the extent demo that comes with TAChart for details.
Note that the extent already has changed when the AfterMouseUp event fires. Therefore, the extent to be added to the history is the PrevLogicalExtent of the chart -- this is the viewport that was active before the extent was changed:
procedure TForm1.ChartToolset1ZoomDragTool1AfterMouseUp(ATool: TChartTool;
  APoint: TPoint);
begin
  ZoomHistory.Add(Chart1.PrevLogicalExtent);
end;
Maybe, we could show in the status line also the current zoom/pan level, this is the count of items in the history. The ChartExtentHistory has a corresponding property Count for that. So, let's add the following line to the OnExtentChanged event handler of the chart:
Statusbar1.Panels[1].Text := Format('History count: %d', [ZoomHistory.Count]);And how to we restore the previous zoom level? By using one more ChartTool. We don't have any special requirements, so we take a UserDefinedChartTool. Set its Shift property such that the tool reacts on a click of the middle mouse button. And in the OnAfterMouseClick event handler we read the last item from the history (ZoomHistory.Pop) and assign the extent rectangle to the chart's LogicalExtent which adjusts the viewport accordingly. The item is removed from the history stack after reading. The zoom level display in the status line adjusts automatically because the event OnExtentChanged is triggered. Note that we have to check for an empty history to avoid an exception.
procedure TForm1.ChartToolset1UserDefinedTool1AfterMouseUp(ATool: TChartTool;
  APoint: TPoint);
begin
  if ZoomHistory.Count > 0 then
    Chart1.LogicalExtent := ZoomHistory.Pop;
end;
If you want to quickly return to the unzoomed view at magnification 1 you can drag with the left mouse button in any direction other than left-top to right-bottom, or just click into the chart. Since we introduced the middle mouse button for unzooming the user interface may be more consistent if we'd add another UserDefinedChartTool and assign its Shift property to ssMiddle and ssShift -- I associate the ⇧ Shift key with the action of making something bigger, like lowercase to uppercase characters. Therefore, the combination of the middle key for unzooming with the ⇧ Shift key could be remembered to trigger unzooming in a large step.
Nevertheless, it may be difficult for the user to keep in mind all the combinations of keys. Therefore, add a panel to the form with some labels and give instructions on zooming, panning and unzooming. We can also place here our magnification and history level infos, i.e. the status line is obsolete and can be deleted.
So, here is the final result of this tutorial project. Enjoy!
Source code
project1.lpr
program project1;

{$mode objfpc}{$H+}

uses
  {$IFDEF UNIX}{$IFDEF UseCThreads}
  cthreads,
  {$ENDIF}{$ENDIF}
  Interfaces, // this includes the LCL widgetset
  Forms, Unit1, tachartlazaruspkg
  { you can add units after this };

{$R *.res}

begin
  RequireDerivedFormResource := True;
  Application.Initialize;
  Application.CreateForm(TForm1, Form1);
  Application.Run;
end.
unit1.pas
unit unit1;

{$mode objfpc}{$H+}

interface

uses
  Classes, ExtCtrls, StdCtrls, SysUtils, FileUtil, TAGraph, TAFuncSeries,
  TASources, Forms, Controls, Graphics, Dialogs, ComCtrls, TATypes, TATools,
  types;

type

  { TForm1 }

  TForm1 = class(TForm)
    Chart1: TChart;
    Chart1ColorMapSeries1: TColorMapSeries;
    ChartToolset1: TChartToolset;
    ChartToolset1PanDragTool1: TPanDragTool;
    ChartToolset1UserDefinedTool1: TUserDefinedTool;
    ChartToolset1UserDefinedTool2: TUserDefinedTool;
    ChartToolset1ZoomDragTool1: TZoomDragTool;
    ColorSource: TListChartSource;
    Label1: TLabel;
    Label2: TLabel;
    Label3: TLabel;
    Label4: TLabel;
    Label5: TLabel;
    Label6: TLabel;
    Label7: TLabel;
    Label8: TLabel;
    Label9: TLabel;
    LblMagnification: TLabel;
    LblHistoryCount: TLabel;
    Panel1: TPanel;
    Panel2: TPanel;
    Panel3: TPanel;
    procedure Chart1ColorMapSeries1Calculate(const AX, AY: Double;
      out AZ: Double);
    procedure Chart1ExtentChanged(ASender: TChart);
    procedure ChartToolset1UserDefinedTool1AfterMouseUp(ATool: TChartTool;
      APoint: TPoint);
    procedure ChartToolset1UserDefinedTool2AfterMouseUp(ATool: TChartTool;
      APoint: TPoint);
    procedure ChartToolset1ZoomDragTool1AfterMouseUp(ATool: TChartTool;
      APoint: TPoint);
    procedure FormCreate(Sender: TObject);
    procedure FormDestroy(Sender: TObject);
  private
    { private declarations }
    ZoomHistory: TChartExtentHistory;
    procedure PopulateColorSource;
  public
    { public declarations }
  end;

var
  Form1: TForm1;

implementation

{$R *.lfm}

uses
  TAChartUtils, TAGeometry;

const
  MANDELBROT_NUM_ITERATIONS = 100;
  MANDELBROT_ESCAPE_RADIUS = 2.0;
  MANDELBROT_LIMIT = sqr(MANDELBROT_ESCAPE_RADIUS);

function InMandelBrotSet(c: TDoublePoint; out Iterations: Integer;
  out z: TDoublePoint): Boolean;
var
  j: Integer;
begin
  Iterations := 0;
  z := DoublePoint(0.0, 0.0);
  for j:=0 to MANDELBROT_NUM_ITERATIONS-1 do begin
    z := DoublePoint(
      sqr(z.X) - sqr(z.Y) + c.X,
      2 * z.X * z.Y + c.Y
    );
    if sqr(z.X) + sqr(z.Y) > MANDELBROT_LIMIT then begin
      Result := false;
      // point did escape --> c is not in Mandelbrot set
      exit;
    end;
    inc(Iterations);
  end;
  Result := true;
end;

{ TForm1 }

procedure TForm1.FormCreate(Sender:TObject);
begin
  PopulateColorSource;
  ZoomHistory := TChartExtentHistory.Create;
  ZoomHistory.Capacity := 100;
end;

procedure TForm1.FormDestroy(Sender: TObject);
begin
  ZoomHistory.Free;
end;

procedure TForm1.Chart1ColorMapSeries1Calculate(const AX, AY: Double;
  out AZ: Double);
var
  iterations: Integer;
  z: TDoublePoint;
begin
  AZ := (AX - Chart1.GetFullExtent.a.x) / (Chart1.GetFullExtent.b.x - Chart1.GetFullExtent.a.x);
    if InMandelBrotSet(DoublePoint(AX, AY), iterations, z) then
    AZ := -1
  else
    AZ := iterations / MANDELBROT_NUM_ITERATIONS;
end;

procedure TForm1.Chart1ExtentChanged(ASender: TChart);
var
  cex, fex: TDoubleRect;
  factor: double;
begin
  cex := Chart1.CurrentExtent;
  fex := Chart1.GetFullExtent;
  if cex.b.x = cex.a.x then exit;

  factor := (fex.b.x - fex.a.x) / (cex.b.x - cex.a.x);
  if factor > 1e6 then
    LblMagnification.Caption := Format('Magnification: %.0e', [factor])
  else
    LblMagnification.Caption := Format('Magnification: %0.n', [factor]);

  LblHistoryCount.Caption := Format('History count: %d', [ZoomHistory.Count]);
end;

procedure TForm1.ChartToolset1UserDefinedTool1AfterMouseUp(ATool: TChartTool;
  APoint: TPoint);
begin
  if ZoomHistory.Count > 0 then
    Chart1.LogicalExtent := ZoomHistory.Pop;
end;

procedure TForm1.ChartToolset1UserDefinedTool2AfterMouseUp(ATool: TChartTool;
  APoint: TPoint);
begin
  Chart1.ZoomFull;
end;

procedure TForm1.ChartToolset1ZoomDragTool1AfterMouseUp(ATool: TChartTool;
  APoint: TPoint);
begin
  ZoomHistory.Add(Chart1.PrevLogicalExtent);
end;

procedure TForm1.PopulateColorSource;
const
  DUMMY = 0.0;
begin
  with ColorSource do begin
    Clear;
    Add(-1.0, DUMMY, '', clBlack);
    Add( 0.0, DUMMY, '', clBlue);
    Add( 0.3, DUMMY, '', clRed);
    Add( 1.0, DUMMY, '', clYellow);
  end;
end;

end.
unit1.lfm
object Form1: TForm1
  Left = 326
  Height = 285
  Top = 155
  Width = 468
  Caption = 'Form1'
  ClientHeight = 285
  ClientWidth = 468
  OnCreate = FormCreate
  OnDestroy = FormDestroy
  LCLVersion = '1.1'
  object Chart1: TChart
    Left = 4
    Height = 277
    Top = 4
    Width = 288
    AxisList = <
      item
        Visible = False
        Minors = <>
        Title.LabelFont.Orientation = 900
      end
      item
        Visible = False
        Alignment = calBottom
        Minors = <>
      end>
    Extent.UseXMax = True
    Extent.UseXMin = True
    Extent.UseYMax = True
    Extent.UseYMin = True
    Extent.XMax = 0.8
    Extent.XMin = -2.2
    Extent.YMax = 1.5
    Extent.YMin = -1.5
    Foot.Brush.Color = clBtnFace
    Foot.Font.Color = clBlue
    Proportional = True
    Title.Brush.Color = clBtnFace
    Title.Font.Color = clBlue
    Title.Text.Strings = (
      'TAChart'
    )
    Toolset = ChartToolset1
    OnExtentChanged = Chart1ExtentChanged
    Align = alClient
    BorderSpacing.Around = 4
    ParentColor = False
    object Chart1ColorMapSeries1: TColorMapSeries
      ColorSource = ColorSource
      Interpolate = True
      OnCalculate = Chart1ColorMapSeries1Calculate
      StepX = 1
      StepY = 1
    end
  end
  object Panel1: TPanel
    Left = 296
    Height = 285
    Top = 0
    Width = 172
    Align = alRight
    BevelOuter = bvNone
    ClientHeight = 285
    ClientWidth = 172
    TabOrder = 1
    object Panel2: TPanel
      Left = 0
      Height = 213
      Top = 72
      Width = 172
      Align = alClient
      BevelOuter = bvNone
      ClientHeight = 213
      ClientWidth = 172
      TabOrder = 0
      object Label2: TLabel
        Left = 6
        Height = 20
        Top = 8
        Width = 84
        Caption = 'Instructions'
        Font.Style = [fsBold]
        ParentColor = False
        ParentFont = False
      end
      object Label1: TLabel
        Left = 6
        Height = 20
        Top = 37
        Width = 58
        Caption = 'Left-drag'
        Font.Style = [fsItalic]
        ParentColor = False
        ParentFont = False
      end
      object Label3: TLabel
        Left = 6
        Height = 20
        Top = 80
        Width = 78
        Caption = 'Middle-click'
        Font.Style = [fsItalic]
        ParentColor = False
        ParentFont = False
      end
      object Label4: TLabel
        Left = 6
        Height = 20
        Top = 120
        Width = 136
        Caption = 'Middle-click w/SHIFT'
        Font.Style = [fsItalic]
        ParentColor = False
        ParentFont = False
      end
      object Label5: TLabel
        Left = 6
        Height = 20
        Top = 161
        Width = 69
        Caption = 'Right-drag'
        Font.Style = [fsItalic]
        ParentColor = False
        ParentFont = False
      end
      object Label6: TLabel
        Left = 19
        Height = 20
        Top = 56
        Width = 38
        Caption = 'zoom'
        ParentColor = False
      end
      object Label7: TLabel
        Left = 22
        Height = 20
        Top = 96
        Width = 112
        Caption = 'unzoom (history)'
        ParentColor = False
      end
      object Label8: TLabel
        Left = 19
        Height = 20
        Top = 136
        Width = 79
        Caption = 'full unzoom'
        ParentColor = False
      end
      object Label9: TLabel
        Left = 19
        Height = 20
        Top = 177
        Width = 25
        Caption = 'pan'
        ParentColor = False
      end
    end
    object Panel3: TPanel
      Left = 0
      Height = 72
      Top = 0
      Width = 172
      Align = alTop
      BevelOuter = bvNone
      ClientHeight = 72
      ClientWidth = 172
      TabOrder = 1
      object LblMagnification: TLabel
        Left = 6
        Height = 20
        Top = 8
        Width = 95
        Caption = 'Magnification:'
        ParentColor = False
      end
      object LblHistoryCount: TLabel
        Left = 6
        Height = 20
        Top = 29
        Width = 91
        Caption = 'History count:'
        ParentColor = False
      end
    end
  end
  object ColorSource: TListChartSource
    left = 115
    top = 57
  end
  object ChartToolset1: TChartToolset
    left = 115
    top = 120
    object ChartToolset1ZoomDragTool1: TZoomDragTool
      Shift = [ssLeft]
      OnAfterMouseUp = ChartToolset1ZoomDragTool1AfterMouseUp
    end
    object ChartToolset1PanDragTool1: TPanDragTool
      Shift = [ssRight]
      OnAfterMouseUp = ChartToolset1ZoomDragTool1AfterMouseUp
    end
    object ChartToolset1UserDefinedTool1: TUserDefinedTool
      Shift = [ssMiddle]
      OnAfterMouseUp = ChartToolset1UserDefinedTool1AfterMouseUp
    end
    object ChartToolset1UserDefinedTool2: TUserDefinedTool
      Shift = [ssShift, ssMiddle]
      OnAfterMouseUp = ChartToolset1UserDefinedTool2AfterMouseUp
    end
  end
end
Related tutorials
- TAChart Tutorial: Getting started: first steps with TAChart
- TAChart Tutorial: Chart Tools: introduction to chart tools
- TAChart Tutorial: Function Series: introduces
TFuncSerieswhich follows a similar concept asTColorMapSeries