

Heaptrc is a unit that can be used to debug allocation and deallocation of memory blocks.
It keeps track of calls to GetMem/FreeMem calls, and, implicitly, of New/Dispose statements.
Do not add the Heaptrc unit manually.
The Heaptrc unit needs to be loaded before Lineinfo and only the compiler can do that.
Heaptrc is also a memory manager, so do not try to use any memory manager – including Heaptrc itself – in the uses clause, because that may lead to memory corruption and false results.
This topic contains a note with example code to handle such a case in a generic way.
When a program using Heaptrc ends, Heaptrc can write out the total memory used and a list of allocated but not freed blocks to a file. When run in the console (*nix or Windows), Heaptrc will print this output to screen unless otherwise instructed. In Lazarus GUI programs on Windows, the output will appear in numerous small dialog boxes, which may be very unpractical, although you can redirect output to file.
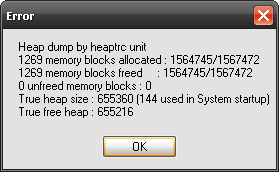
On *nix (including BSD, Linux and macOS), by default, nothing will be shown for GUI programs. In this case, to see heaptrc output when you terminate your program (GUI or non-GUI), open "Console In/Output" (Ctrl+Alt+O or View -> Debug Window -> ...)
See leakview for details on how to make use of Heaptrc effectively.
Usage
editUsing Heaptrc in Lazarus
edit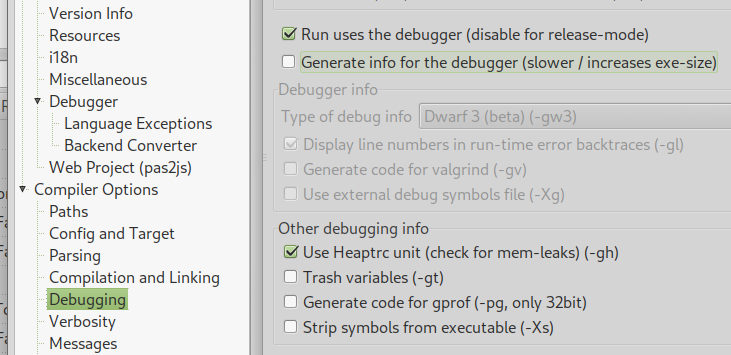 Linux Heaptrc config.
To enable this in your Lazarus project:
Go to Project -> Project Options -> Debugging and ensure that Use Heaptrc unit (check for mem-leaks) (-gh) is ticked.
Windows users will see a small window pop up at completion of their app containing the Heaptrc report. Linux users should also -
- Tick Run uses the debugger (Disable for release mode) in that same Project -> Project Options -> Debugging screen.
- Open the console window, View -> Debug Windows -> Console In/Output so they can see the Heaptrc report (and probably lots of other, useful debug info).
- Ensure that the cmem unit is not enabled in the project file (while testing for memory leaks). You would have this unit enabled if you are using Linux/Unix multithreaded code.
It makes sense to also tick Generate info for the debugger (slower/increases exe-size and Display line numbers in run-time error backtraces (-gl). Please remember to turn all these debugging functions off in your release version !
Using Heaptrc in FPC
editAdd a parameter -gh to your compilation command line or to fpc.cfg.
fpc -gh Helloworld.pasor usually combined with line info:
fpc -glh Helloworld.pasThis will add Heaptrc implicitly as a hidden first unit of the program's uses clause.
All examples given on this page can only be used in the main project file. That is, in a file that begins with Program ..., and not Unit .... Typically this file has the extension .lpr or .pp. You can open it in Lazarus via the Project > View project source menu.
Don't confuse using {$if declared(UseHeapTrace)}} with using {$if defined(UseHeapTrace)}} or {$ifdef UseHeapTrace}}. To check heaptrc you need the first option since the others will always be false.
You can test in code if Heaptrc is active by examining the global constant UseHeapTrace for the presence of Heaptrc and its status like so:
program PossiblyHeaptraced(Input, Output, StdErr);
begin
    {$if declared(UseHeapTrace)}
    WriteLn('Heaptrc is used.');
    // Heaptrc reports can be turned off when linked in... so true or false
    WriteLn('Heaptrc is active: ', UseHeapTrace);
    // you can subsequently test/set any Heaptrc reporting options
    {$else}
    WriteLn('No trace of Heaptrc.');
    {$endIf}
end.
Show report only on leak
editIf you want to show Heaptrc report dialog only if there were leaks in your application, then put this assignment somewhere in your main project source file:
{$if declared(UseHeapTrace)}
GlobalSkipIfNoLeaks := True; // supported as of debugger version 3.2.0
{$endIf}
Programmatically disable report
editIf the UseHeapTrace variable is false when the program exits, then the leak will not be reported, even if it is detected. You can use this in your code:
UseHeapTrace := false;Note that changing UseHeapTrace can neither turn heaptrc on nor off, since the memory manager cannot be changed while the program is running. This only controls the output of the leak message at the end of the program.
This is worth considering, for example, when using KeepReleased - this requires a lot of additional memory, and setting UseHeapTrace := false will not free it.
Continue execution even on heap error
editIf you want your application to continue execution even in case of a heap error then manipulate HaltOnError constant at program startup:
HaltOnError := False;Redirect report to file
editIf you want to redirect leak report to file then add this to beginning of you main project file:
SetHeapTraceOutput('Trace.log'); // supported as of debugger version 3.2.0Why Heaptrc should not be added to the uses clause manually
editYou should never add Heaptrc manually in a normal program, because the Heaptrc unit needs to be loaded before Lineinfo for debugging to work properly.
Decoding dwarf debugging info efficiently requires a working heap manager and this means that Heaptrc needs to be loaded before the the DWARF line info decoding unit which is loaded by -gl, so Heaptrc cannot be used explicitly.
Only the compiler itself can insert the unit in its proper place as a hidden first unit in the uses clause. Adding the unit by hand can cause all kind of unwanted side effects. E.g. crashes, reported Lineinfo is not reliable and not all leaks can reliably be reported.
This has always been the case, but is only properly documented from FPC version 3.0.2. So if you still see Heaptrc in your uses clause, remove it! for debugging and reporting to work properly.
If your program is designed to use an alternative memory manager, you can adapt your program's uses clause like so:
program AlternativeMemoryManager(Input, Output, StdErr);
{$mode ObjFPC}
uses
    // This will conditionally switch in a memory manager
    // based on the presence of Heaptrc
    {$if not declared(UseHeapTrace)}
    CMem,
    {$endIf}
    SysUtils, Classes; // the latter two are just to test.

begin
    {$if declared(UseHeapTrace)}
    WriteLn('Heaptrc is used.', ' Heaptrc is active: ', UseHeapTrace);
    {$else}
    WriteLn('No trace of Heaptrc.');
    {$endIf}
end.
In the above example the conditional in the uses clause makes sure that the CMem memory manager is only compiled in if the Heaptrc option is not used.
Experimental 3.3.1
editIn 3.3.1 trunk, heaptrc got a rework with some new features. Read more: MR !1278 💀 REWRITE HEAPTRC.PP 💀.
AutoCheckHeapStep & CheckHeap
editheaptrc incrementally checks the heap for out-of-bound writes by prepending head_size-sized heads (default: 0) and appending tail_size-sized tails (default: 4) to allocations and checking up to AutoCheckHeapStep (default: 3) allocations on every operation (GetMem, FreeMem, ReallocMem, MemSize). Increase AutoCheckHeapStep to make it more aggressive, or set to 0 to disable. Allocations will still be checked at the time of their own freeing / reallocation, which has more chances of being too late.
CheckHeap([step]) can also be called manually; step defaults to High(SizeUint), thus checking the entire heap.
If you have a buffer overflow and can’t find the culprit, try bisecting & pinpointing it with CheckHeap: if the code
CheckHeap;
P[5] := 25;
works, and the code
P[5] := 25;
CheckHeap;
fails, then P[5] := 25; wrote past the end of P.
Also, if you’re getting an access violation when accessing some P, prepending it with CheckPointer(P) can provide more information, especially in conjunction with KeepReleased*. Note that both CheckHeap(High(SizeUint)) and CheckPointer are extremely slow as they scan the entire heap, so use sparingly.
KeepReleasedBytes & KeepReleasedPercents
editKeeping released memory allows heaptrc to detect write-after-free and provide more information in case of double frees or CheckPointer pointing into freed memory. For example,
var
    p: pointer;
begin
    p := GetMem(100);
    FreeMem(p);
    FreeMem(p); // or CheckPointer(p + 10);
end.
can only report:
pointer <...> does not point to valid memory blockwhile
var
    p: pointer;
begin
    KeepReleased := true;
    p := GetMem(100);
    FreeMem(p);
    FreeMem(p); // or CheckPointer(p + 10);
end.
is able to give more specific:
pointer <...> (size 100) was freed at
$main, line 6

and touched again at
$main, line 7
However, KeepReleased := true; keeps all freed memory, which is not always feasible.
As a compromise, you might prefer to keep up to KeepReleasedBytes + KeepReleasedPercents%.
It is not well defined what the percentage is relative to :D, but currently it’s a percentage of the maximum amount of memory allocated so far.
Note KeepReleased := true; is simply (and technically) an equivalent of KeepReleasedBytes := High(SizeUint);.
It can also be set via the HEAPTRC environment variableoption KeepReleased, with the following syntax:
HEAPTRC=KeepReleased,...— corresponds toKeepReleased := true;HEAPTRC=KeepReleased=10%+100k,...— corresponds toKeepReleasedPercents := 10; KeepReleasedBytes := 100 * 1024;
Suffixes:10(no suffix) — ten bytes,10k— ten kilobytes,10m— ten megabytes,10g— ten gigabytes,10%or10pc(if you’re a Windows user and are afraid of escaping%) — ten percent.
An arbitrary number of summands is supported, but no other mathematics (this is not an expression parser).
TraceDepth
editThe TraceDepth global property controls the maximum depth of the stack traces. Default is 16, limit is 64. Setting it to 0 improves performance; 999 (shortcut for 64) gives better traces.
Can be set from the environment: HEAPTRC=TraceDepth=999,....
WalkHeap
editThe WalkHeap function is similar to WalkAllocatedBlocks from FastMM4 and the like: it enumerates all blocks allocated through heaptrc. For example, this code builds a histogram of allocations:
{$modeswitch anonymousfunctions}
uses
    heaptrc;

var
    histogram: array[0 .. 127] of record count, size: SizeUint; end;
    i: SizeInt;

begin
    GetMem(100);
    GetMem(200);
    GetMem(300);
    GetMem(3000);

    FillChar(histogram, sizeof(histogram), 0);
    WalkHeap(
        procedure {WalkBlock}(const bi: TWalkBlockInfo; param: pointer)
        var
            hi: SizeUint;
        begin
            if bi.isInternalHeaptrcAllocation then exit;
            hi := bi.size div 16;
            if hi > High(histogram) then hi := High(histogram);
            inc(histogram[hi].count);
            inc(histogram[hi].size, bi.size);
        end, nil);

    writeln('# of live allocations by size:');
    for i := 0 to High(histogram) do
        if histogram[i].count <> 0 then
        begin
            if i < High(histogram) then
                write(16 * i:4, ' ~ ', 16 * i + 15:4)
            else
                write(16 * i:4, ' ~ ', '+Inf':4);
            writeln(': ', histogram[i].count, ' (', histogram[i].size, ' bytes total).');
        end;
end.
You can allocate memory inside the callback. This is not recommended, and touching allocations made before the call to WalkHeap call can lead to unpredictable results (if you free a block that is currently being traversed), but allocations made by the callbacks from scratch are fine (still, don’t overuse this possibility).
See also
edit-
gitlab
- leakview: Examples how to enable Heaptrc in Lazarus and Free Pascal.
- RTL Reference for unit 'Heaptrc' (this link is not yet up-to-date)