Difference between revisions of "LazProfiler"
| Line 50: | Line 50: | ||
just uncheck the checkbox in front of the procedure/function name<br> | just uncheck the checkbox in front of the procedure/function name<br> | ||
in the profiler output window.<br> | in the profiler output window.<br> | ||
| − | [[File:LP05.png]] | + | [[File:LP05.png]]<br> |
Depending on the grouping you can disable complete units/classes. | Depending on the grouping you can disable complete units/classes. | ||
Revision as of 12:16, 30 September 2018
About
LazProfiler is an IDE addon which adds a One-Click-Profiler to Lazarus.
Screenshot

Download
- It's available on GitHub.
System Requirements / Dependencies
- FPC trunk (needs generics and additional PascalParser funktionality)
- Lazarus trunk (revision 56254 and above)
Installation
Download from here and install manually.
It depends on LCLExtension, EpikTimer and VirtualTreeView.
Support page
http://forum.lazarus.freepascal.org/index.php/topic,38983.0.html
Using LazProfiler
Start profiling
- Open your project (if not done already)
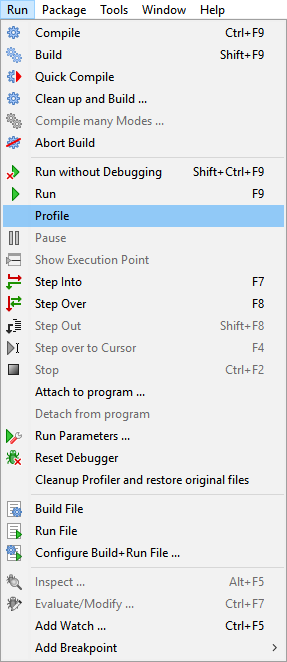
- Choose Profile from Run menu:
- Use your program
- Close your program
- study LazProfiler output:


Show output
- Choose Profiler from View menu:


Cleanup profiler
In case the instrumenting of the sources produce not compileable code
you can reset the profiler and tidy things up by choosing
Cleanup Profiler from Run menu:
Influencing profiling
Hints in source code
By default the profiling automatically starts.
If you just want to profile some parts of your code
you can surround it by two comments:
// start-profiler
code_to_profile;
// stop-profiler
Disable instrumenting
If you want to exclude procedures/functions from beeing instrumented,
just uncheck the checkbox in front of the procedure/function name
in the profiler output window.

Depending on the grouping you can disable complete units/classes.
How does it work
When profiling is started the following steps are done:
- project is build to test if project is okay
- all sources in the projects unit and include directories are backuped (except units below fpc and lazarus source directories)
- procedures and funtions in units are instrumented with special profiling code
- project is build with instrumented code
- instumented sources are deleted and backups are restored
- program is run with no debugger
- profiling result is shown when program ends
Known issues
- Profiling does not stop counting at ShowModal, ShowMessage, ...
- Profiling for packages in subfolders of project does not work
Version History
- 0.1.0.0
- Initial release
- 0.1.1.0
- leaving sources instrumented if compile after instrumenting fails
- 0.1.2.0
- checking if backup was successfully created before writing instrumented code to original file
- 0.1.3.0
- renamed menu entries
- include IncludePath. Patch by zamtmn.
- minor refactoring
- fixed recognition of declared record in procedure var section
- fixed memory leaks