Difference between revisions of "IDE Window: Debugger Options"
m |
|||
| Line 2: | Line 2: | ||
{{IDE Window: Debugger Options}} | {{IDE Window: Debugger Options}} | ||
| − | = | + | == General == |
| − | + | <center>[[Image:Debugger_options_general.png]]</center> | |
| − | |||
| − | |||
| − | |||
| − | |||
| − | |||
| − | == Debugger type and path == | + | === Debugger type and path === |
Choose the debugger. | Choose the debugger. | ||
* '''None''' - No debugger. On Run, simply execute the program. | * '''None''' - No debugger. On Run, simply execute the program. | ||
| − | * '''GNU debugger (gdb) - The gdb is not part of Lazarus. You must install it yourself. This is the connector to gdb. You must set the path to gdb (for example /usr/bin/gdb) in the field below. | + | * '''GNU debugger (gdb)''' - The gdb is not part of Lazarus. You must install it yourself. This is the connector to gdb. You must set the path to gdb (for example /usr/bin/gdb) in the field below. |
* '''GNU debugger through SSH''' - for remote debugging. You can use a SSH connection to a another computer and execute gdb there. You need a SSH connection without prompt for password for this. See the SSH documentation on how to do that. | * '''GNU debugger through SSH''' - for remote debugging. You can use a SSH connection to a another computer and execute gdb there. You need a SSH connection without prompt for password for this. See the SSH documentation on how to do that. | ||
| − | == Additional search path == | + | === Additional search path === |
You can add extra directories, where to search for sources, named in the debugging information of the executable. This is used for all projects. | You can add extra directories, where to search for sources, named in the debugging information of the executable. This is used for all projects. | ||
| − | == Debugger general options == | + | === Debugger general options === |
| − | === Show message on stop === | + | ==== Show message on stop ==== |
Enable this to show a notification, when programs stops. | Enable this to show a notification, when programs stops. | ||
| − | == Debugger specific options == | + | === Debugger specific options === |
Each debugger type has special options. | Each debugger type has special options. | ||
| − | === GNU debugger (gdb) === | + | ==== GNU debugger (gdb) ==== |
| − | * '''OverrideRTLCallingConvention''': | + | * '''OverrideRTLCallingConvention''': |
| + | This is an internal flag and can stay default. | ||
| + | To handle software exceptions, Lazarus uses some internal breakpoints on locations where these exceptions are raised. When an executable is fully compiled with debug info (thus also the RTL) one can retrieve the agruments passed to those exception routines. However that is usually not the case, so Lazarus has its internal way of examinig the callstack and registers. In order to interprete those arguments correctly it needs to know what the internal calling convention was of those routines. Pre FPC 1.9.x arguments were passed on stack. Nowadays arguments are passed in registers. | ||
| + | In case the the FPC version detection routine draws the wrong conclusion, one can override the calling convention here. | ||
| − | = Event Log = | + | == Event Log == |
| + | <center>[[Image:Debugger_options_eventlog.png]]</center> | ||
| − | == General == | + | === General === |
| + | |||
| + | Eventually logging info should go the the [[IDE Window:Event Log|event log]], for now it is show in the [[IDE Window: Debug Output|debug output]] window. | ||
| − | * '''Clear log on run''': clear | + | * '''Clear log on run''': clear the event log, on each start of the program. |
* '''Limit line count to''': keep only the last lines of output. | * '''Limit line count to''': keep only the last lines of output. | ||
| − | == Messages == | + | === Messages === |
| + | (not implemented) | ||
| − | + | This controls which messages are logged in the event log | |
| − | = Language Exceptions = | + | == Language Exceptions == |
| + | <center>[[Image:Debugger_options_language_exceptions.png]]</center> | ||
Programs can raise exceptions. For example, when a file can not be read. Here you setup, if the debugger should stop on an exception. | Programs can raise exceptions. For example, when a file can not be read. Here you setup, if the debugger should stop on an exception. | ||
| − | == Ignore these exceptions == | + | === Ignore these exceptions === |
| + | Add your exceptions to ignore here. | ||
For example: EDivByZero | For example: EDivByZero | ||
| − | == Break on Lazarus Exceptions == | + | === Break on Lazarus Exceptions === |
| − | + | Uncheck this option if you don't want to stop on any exception | |
| − | = OS Exceptions = | + | == OS Exceptions == |
| + | <center>[[Image:Debugger_options_os_exceptions.png]]</center> | ||
| − | == Signals == | + | === Signals === |
| + | (not implemented) | ||
| − | + | Defines if signals should be handled by the debugger or by the user program. For instance, an div by zero is first signalled by the OS. Then the FPC RTL translates this to an EDivByZero. When the signal is handled by the debugger, the program is stopped before the RTL translates this message. Currently the debugger always stops on a signal. | |
Revision as of 18:20, 22 July 2006
│
Deutsch (de) │
English (en) │
español (es) │
français (fr) │
português (pt) │
русский (ru) │
General

Debugger type and path
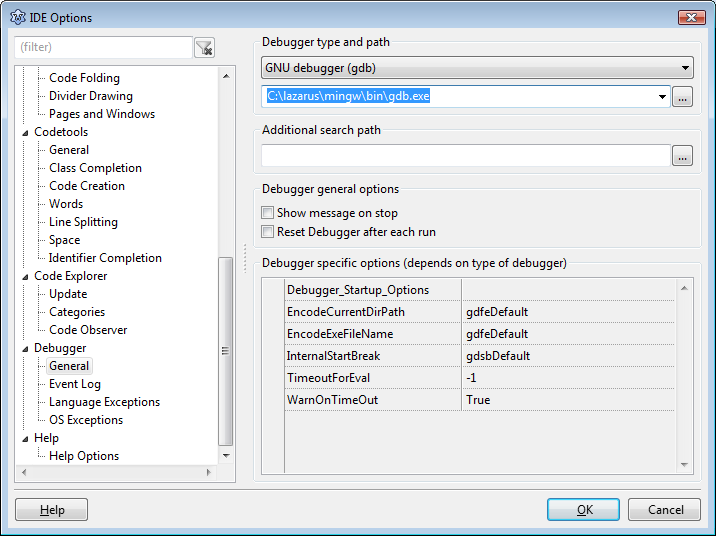
Choose the debugger.
- None - No debugger. On Run, simply execute the program.
- GNU debugger (gdb) - The gdb is not part of Lazarus. You must install it yourself. This is the connector to gdb. You must set the path to gdb (for example /usr/bin/gdb) in the field below.
- GNU debugger through SSH - for remote debugging. You can use a SSH connection to a another computer and execute gdb there. You need a SSH connection without prompt for password for this. See the SSH documentation on how to do that.
Additional search path
You can add extra directories, where to search for sources, named in the debugging information of the executable. This is used for all projects.
Debugger general options
Show message on stop
Enable this to show a notification, when programs stops.
Debugger specific options
Each debugger type has special options.
GNU debugger (gdb)
- OverrideRTLCallingConvention:
This is an internal flag and can stay default. To handle software exceptions, Lazarus uses some internal breakpoints on locations where these exceptions are raised. When an executable is fully compiled with debug info (thus also the RTL) one can retrieve the agruments passed to those exception routines. However that is usually not the case, so Lazarus has its internal way of examinig the callstack and registers. In order to interprete those arguments correctly it needs to know what the internal calling convention was of those routines. Pre FPC 1.9.x arguments were passed on stack. Nowadays arguments are passed in registers. In case the the FPC version detection routine draws the wrong conclusion, one can override the calling convention here.
Event Log

General
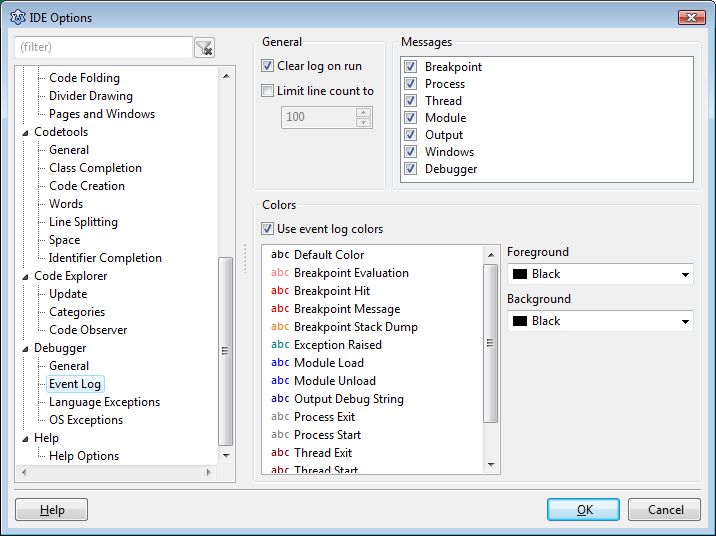
Eventually logging info should go the the event log, for now it is show in the debug output window.
- Clear log on run: clear the event log, on each start of the program.
- Limit line count to: keep only the last lines of output.
Messages
(not implemented)
This controls which messages are logged in the event log
Language Exceptions

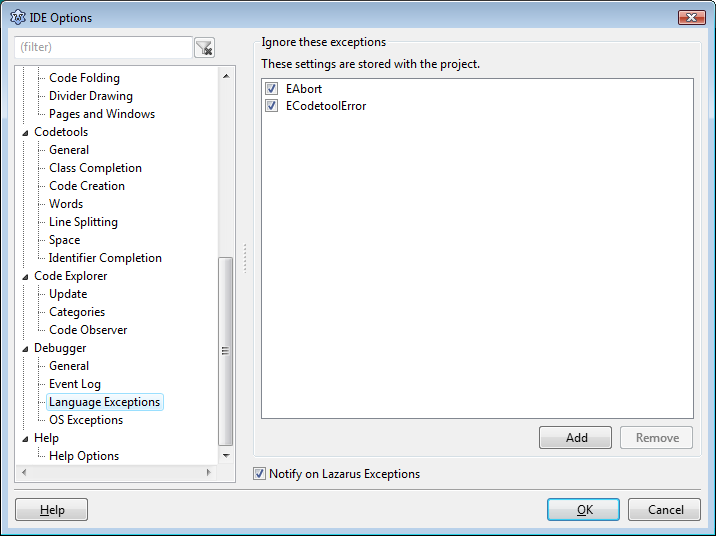
Programs can raise exceptions. For example, when a file can not be read. Here you setup, if the debugger should stop on an exception.
Ignore these exceptions
Add your exceptions to ignore here. For example: EDivByZero
Break on Lazarus Exceptions
Uncheck this option if you don't want to stop on any exception
OS Exceptions

Signals
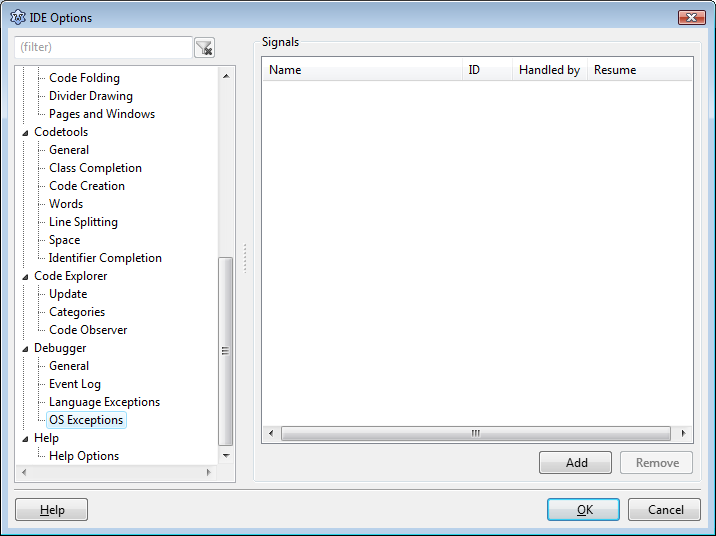
(not implemented)
Defines if signals should be handled by the debugger or by the user program. For instance, an div by zero is first signalled by the OS. Then the FPC RTL translates this to an EDivByZero. When the signal is handled by the debugger, the program is stopped before the RTL translates this message. Currently the debugger always stops on a signal.