

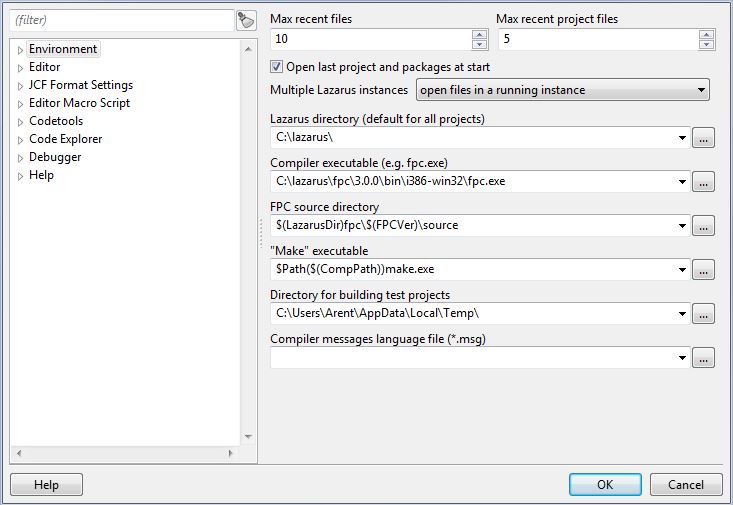
 IDE Options main screen
Environment
{{:IDE Window: Environment Options]]
Editor
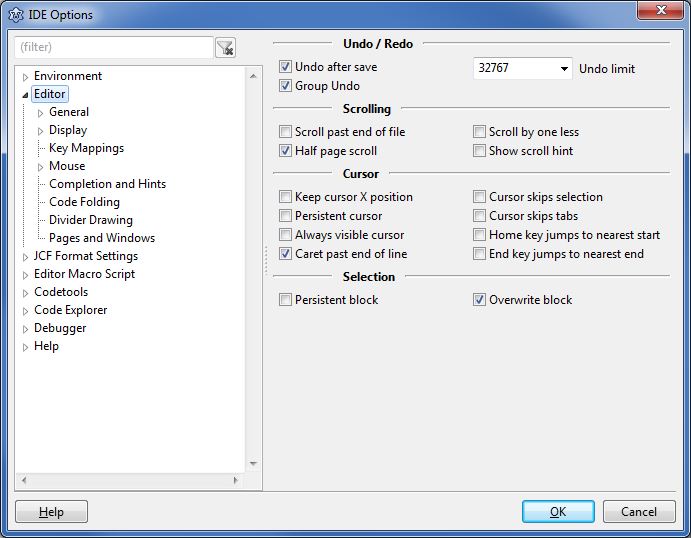 IDE Options - Editor
This is part of the online help for the IDE.
It describes the section: "Editor Options". You can open the described dialog in your IDE via:
- The menu: "Tools" => "Options" / Editor options ...
- The source-editor pop-up menu: "Editor properties ...
The available editor options are:
- General
- Undo / Redo
- Scrolling
- Indent and Tabs
Please also see Codetools for automatic indent of Pascal sources - Cursor
- Selection
- Misc
- Showing Whitespace
- Trimming spaces
- Copy/paste: unselected / fold
- Search
- Display
- Gutter / Margin
- Font
- Line-spacing
- Colors
- Highlighting Pascal/Language specific elements
- General Highlighting (Selection, Line Highlights, ...)
- Markup and Matches
- Highlight other occurrences of the current word
- Matching brackets
- Extended Pascal-Keyword settings
- User defined markup
- Highlight your own chosen words
- Key Mappings
- Keyboard
- See Lazarus IDE Shortcuts.
- Mouse settings
- Mouse
- Key Mappings
- Completion and Hints
- Automatic removal of unused events
- Automatic completion of Pascal blocks (begin/end)
- Automatic completion of identifiers
- Hints in the Editor
- Code Folding
- Source/Text folding
- Divider Drawing
- Drawing divider lines
- Pages and Windows
- Notebook and its tabs
- Automatic selection of windows for code navigation
JCF Format Settings
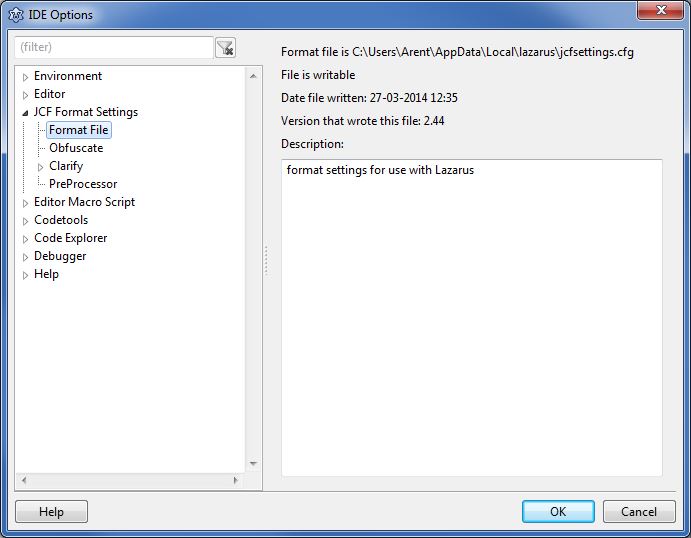 JCF Format Settings Options
Jedi Code Format
See: http://jedicodeformat.sourceforge.net/
Editor Macro Script
IDE Window: Editor Macro Script
Codetools
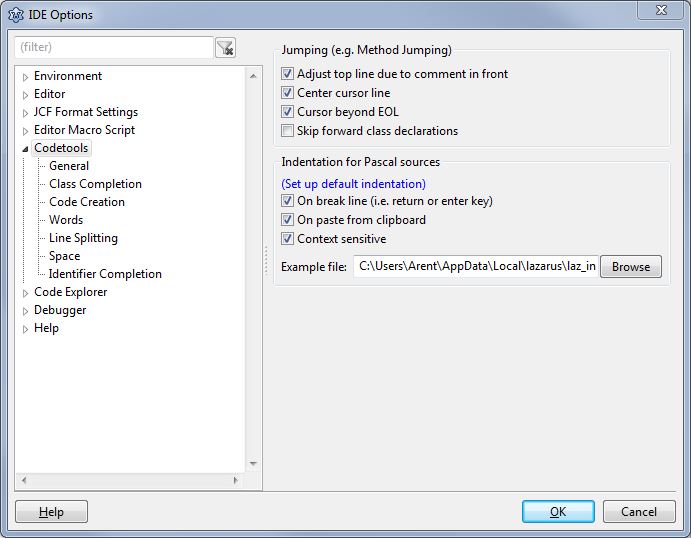 Codetool options
General
Additional Source search path for all projects/packages
If you are too lazy to setup packages and you do not want to share your projects/packages, then you can set here a global search path. Please note: "global" refers to codetools, and does not include the settings for the compiler. You have to add the path to the fpc.cfg as well.
Jumping (e.g. Method Jumping)
- Adjust top line due to comment in front: When jumping from method declaration to method body, the IDE tries to position the source editor, so that the top line shown in the editor is the first line of the procedure. Normally a comment in front belongs to the procedure as well. Enable this option to scroll so that the comment is shown too.
- Center cursor line: If jumping from the method body to the declaration in the class (or interface) the IDE can center line vertically in the editor.
- Cursor beyond EOL: When the IDE jumps to a new position it is allowed to jump to a nice position, even if this is beyond the end of the line. This must be enabled for the source editor too.
- Skip forward declarations: When doing a find declaration the codetools searches upwards and stops on the first fit. This might be a forward declaration, e.g. TControl = class;. If this option is enabled the codetools will jump to the real class declaration instead.
- Jump directly to method body: When Find declaration jumps to a method/procedure declaration it takes an extra jump to the implementation.
Indentation
Since 0.9.29 the source editor has a smarter auto indenter for pascal. It imitates your indentation. For example when you press return after a try the indenter will search for other try..finally blocks and indents accordingly. When pasting code from the clipboard the indenter will indent it too.
- On break line: Indent when pressing return and breaking the line. If disabled the default indenter of synedit is used, which indents as the line above.
- On paste form clipboard: Indent when copying text from the clipboard. At the moment it only indents when inserting at column 1.
- Context sensitive: The indenter searches in the surrounding code for similar code and copies the indentation. This means it searches first the code in front, then the code below. If it is a project unit, all project units are searched. If it is a package unit all package units are searched. Finally the example file is searched. If this option is disabled only the example file is searched.
- Example file: This file contains beautiful code examples. You can edit the default file or select another. It can be a unit or program source.
For a detailed explanation see Fully automatic indentation.
Class Completion
Insert class part
Defines where to insert new variables and method to the class declaration:
- Alphabetically
- Last
Insert methods
Where to insert new method bodies. Methods of the same class are always grouped together.
- Alphabetically
- Last
- Class order: Use the same order as in the class declaration
Method default section
What class visibility should be used for new methods by default (since 1.8).
- Private
- Protected
- Public
- Published
Flags
- Mix methods and properties: When adding a new method allow to insert between properties.
- Update all method signatures:
- Enabled: Class completion updates all method signature (i.e. case, modifiers) from declaration to implementation.
- Disabled: Class completion updates only the method signature under the cursor.
- Header comment for class: Add a { TYourClass } comment in front of type.
- Implementation comment for class: Add a { TYourClass } comment in front of the first method body.
Header comment for class
Add a header comment in front of the class declaration. For example { TForm }
Implementation comment for class
Add a comment in front of the first method body. For example { TForm }
Property completion
- Complete properties: Enable to complete incomplete property declarations.
- Read Prefix - the 'Get' in 'function GetColor: TColor'
- Write Prefix - the 'Set' in 'procedure SetColor(aValue: TColor)'
- Stored Prefix - the 'IsStored' in 'function IsStoredColor';
- Variable Prefix - The new private variable name is this prefix plus property name, e.g. the 'F' in 'FColor'.
- Set property Variable - the parameter name for the setter, e.g. the 'aValue' in 'procedure SetColor(aValue: TColor)'.
- is prefix - enable to use aValueColor instead of aValue as parameter name. e.g. 'procedure SetColor(aValueColor: TColor)'.
- use const - enable to use the 'const' accessor for the parameter. e.g. 'procedure SetColor(const aValue: TColor)'.
Code Creation
In this section you can define, where (and in which order) new procedures and units will be inserted.
Procedure insert policy
Where to insert new procedure bodies
- Last (at end of source)
- in front of methods
- behind methods
Keep order of procedures
When inserting new procedure bodies, keep order of the interface.
Words
Keyword policy
How to write new keywords.
Identifier policy
How to write new identifiers.
Line Splitting
Space
Identifier completion
See the tutorial Identifier completion.
Add semicolon
Allow to add missing semicolon. For example:
s:=Caption| //will add a semicolon. It does not add a semicolon if the identifier is a L-Value like in the following example:
Button1|Add assignment operator
This will add a := if the identifier is a L-Value with no sub identifiers. For example:
Caption| // Caption is a string, so Caption:=Automatically invoke after point
If enabled the identifier completion is automatically shown, when user pressed a point . and waited for the time shown in Editor / Automatic Features / Tooltip expression evaluation. For example:
Button1.| // typing the point and wait will show the completion boxAdd parameter brackets
Replace whole identifier
- Enable: replace the whole identifier at cursor
- Disable: replace only the identifier in front of the cursor
Code Explorer
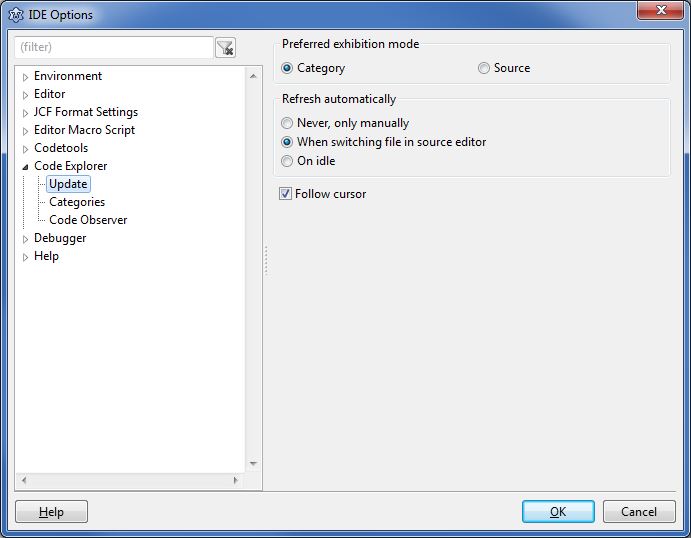 The dialog is explained here: IDE Window: Code Explorer
Update
Preferred Exhibition Mode
- Category - sort all declarations into categories like constants, variables, types, procedures, ...
- Source - show all declarations as they are in the source
Refresh automatically
- Never, only manually - only when pressing the Refresh button
- When switching file in source editor - when switching to another unit
- On idle - whenever the user does not type or move the mouse
Categories
Shows the available categories. Check all that you want to see in the code explorer.
The category Code Observer exists since 0.9.27 and lists uncommon or hard to read code fragments. You can set the details in the next option page.
Code Observer
Complexity
- Long procedures
Lists all procedures with more lines of code than in the edit field to the right. Long procedures are hard to read by others. Use the Extract Procedure tool to split it into several procedures. - Many parameters
Lists all procedures with more parameters than in the edit field to the right. - Many nested procedures
Lists all procedures with more nested sub procedures than in the edit field to the right.
Empty constructs
- Empty procedures
Lists all procedures without code. They can contain comments and directives. The code below will be listed under linux.
begin
  {$IFDEF win32}write;{$ENDIF}
end;- Empty blocks
Lists all empty blocks, like begin..end and repeat..until. Blocks containing comments are not listed. Empty blocks can be endless loops or forgotten to clean up. - Empty class sections
Lists all empty class sections like private, public, protected.
Style
- Unnamed Constants
Lists all literal constants in statements, that means constants that have no name. You can define in the text fields below what should not be listed. - Unsorted visibility
Lists all class sections, that are not sorted. For example if a private section comes behind a public section. - Unsorted members
Lists all class variables, methods and properties that are not sorted alphabetically.
Other
- Wrong indentation
Lists all places with suspicious indentation. For example: In the next example the then statement was accidentally deleted:
for i:=0 to 10 do
  if i=0 then
writeln('');- Published properties without default
Lists all properties without a default value. For example:
published
  property Flag: booolean read FFlag write SetFlag;
Since FPC 2.2.4 such properties are treated as if they have the nodefault specifier. That means they are always saved to the lfm.
- ToDos
Lists alls ToDos. See the ToDo list.
Ignore next unnamed constants
These constants will not be listed in the unnamed category. Examples:
0
1
'a'
'abc'
#3
#$3
Ignore constants in next functions
Constants passed as parameters to the following functions will not be listed in the unnamed category. There are two types. For example:
Write
.ParamByName
Note the point in front of ParamByName.
Result:
Write('A'); // 'A' will be ignored
MemStream.Write('A'); // 'A' will be listed
DataModule1.SQLQuery1.Params.ParamByName('ART_ID').AsString; // will be ignored
ParamByName('ART_ID').AsString; // will be listed
Debugger
This page is outdated. The setting dialog was changed. Options have been moved to new pages and/or the "project settings"
General
This article describes the settings in the Tools/Options menu related to debugging.
In Lazarus 2.2 this frame was replaced by Debugger General Options and Debugger Backend Options
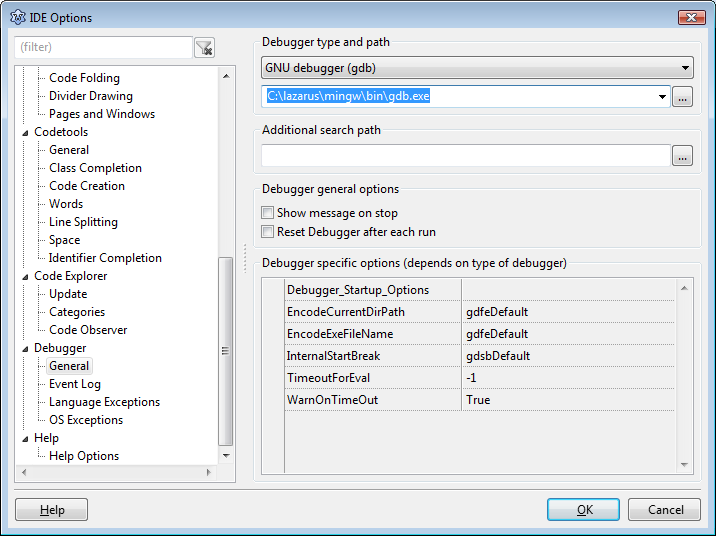
Debugger type and path
Choose the debugger.
- None
- No debugger. On Run, simply execute the program.
FpDebug internal Dwarf-debugger
- GNU debugger (gdb)
- GDB is not a part of Lazarus. Unless you are using Windows or macOS with Xcode, you must install it yourself. This is the connector to gdb. You must set the path to gdb (for example /usr/bin/gdb) in the field below.
- GNU debugger through SSH
- for remote debugging. You can use an SSH connection to another computer and execute gdb there. You need a SSH connection without prompt for password for this. See the SSH documentation on how to do that. This feature has certain limits. Read more ...
- GDB remote debugger (gdbserver)
- for remote debugging.
LLDB Debugger (Alpha)
LLDB Debugger (with fpdebug) (beta)
Additional search path
You can add extra directories, where to search for sources, named in the debugging information of the executable. This is used for all projects.
Debugger general options
- Show message on stop
- Enable this to show a notification, when programs stops.
- Reset debugger after each run
- The IDE keeps GDB running and re-uses it. If you are using a (older) version of GDB that does not support this, then you can start a new GDB instance each time you start a debug session.
Debugger specific options
Each debugger type has special options.
FpDebug internal Dwarf-debugger
NextOnlyStopOnStartLine
GNU debugger (gdb)
- Debugger_Startup_Options
- Pass extra arguments to GDB. This is not needed for normal usage. This is if you are familiar with GDB and wish to modify it's behaviour. Using this option may interfere with the proper working of the debugger
- DisableLoadSymbolsForLibraries
- Prevent loading any symbols from libraries. (Must not be used, if debugging libraries). There are several gdb issues triggered by symbols loaded from libraries. If you get any error mention "solib", try setting this to true. Also see: GDB_Debugger_Tips#Known_Problems_.2F_Errors_reported_by_the_IDE
- EncodeCurrentDirPath/EncodeCurrentFilePath
- Experimental. Those option affect the quoting of certain path/filenames when they are given to GDB. Changing the option to the wrong value will stop the debugger from working.
- InternalStartBreak
- Changes the way the debugger detects your applications, main entry point. It is advised to leave this at default. Other values may be tried, if the debugger report an error "The debugger could not set a breakpoint on the applications entry point**".
- MaxDisplayLengthForString
- For any string (pchar) gdb reads a maximum as specified by this setting. GDB always terminates at the 1st zero. GDB does not really handle pascal strings well.
- UseAsyncCommandMode
- Mainly supported by gdbserver. Setting should be used for any remote debugging (gdbserver/gdb over ssh). See gdb documentation for "set target async". IF supported by gdb, can also be used for local debugging.
- WarnOnInternalError
- Default true. If set to False, internal errors by gdb will be ignored by the IDE. Yet that does not change, that gdb did have an internal error, and that debugging may report incorrect data, or dis-behave in anyway. Neither will it prevent follow up error. It simple skips informing the user, yet fixes nothing. Leave on true, unless you get repeatedly the same internal error, and have tested well, that it does not affect you. (Then the warning dialog would be annoying, and you may want to skip it)
- TimeOutForEval/WarnOnTimeOut
- Read GDB_Debugger_Tips#TimeOuts
Event Log
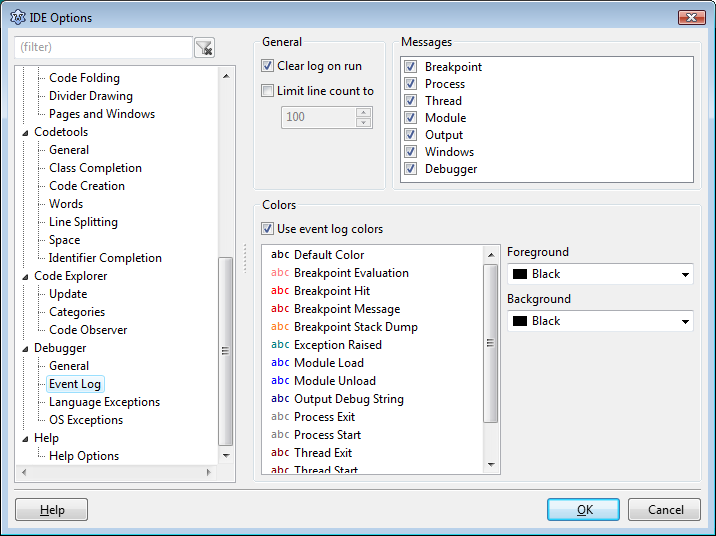
General
Eventually logging info should go the the event log, for now it is show in the debug output window.
- Clear log on run: clear the event log, on each start of the program.
- Limit line count to: keep only the last lines of output.
Messages
The Messages window is usually positioned below the source editor and shown, when building the project. It shows the compiler output and can show the output of external tools.
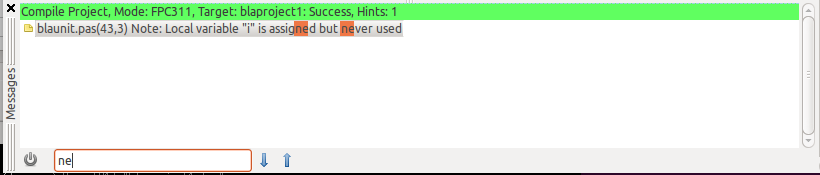
See IDE Window: Messages.
Language Exceptions
Moved to: IDE_Window:_Breakpoints
See also
Help
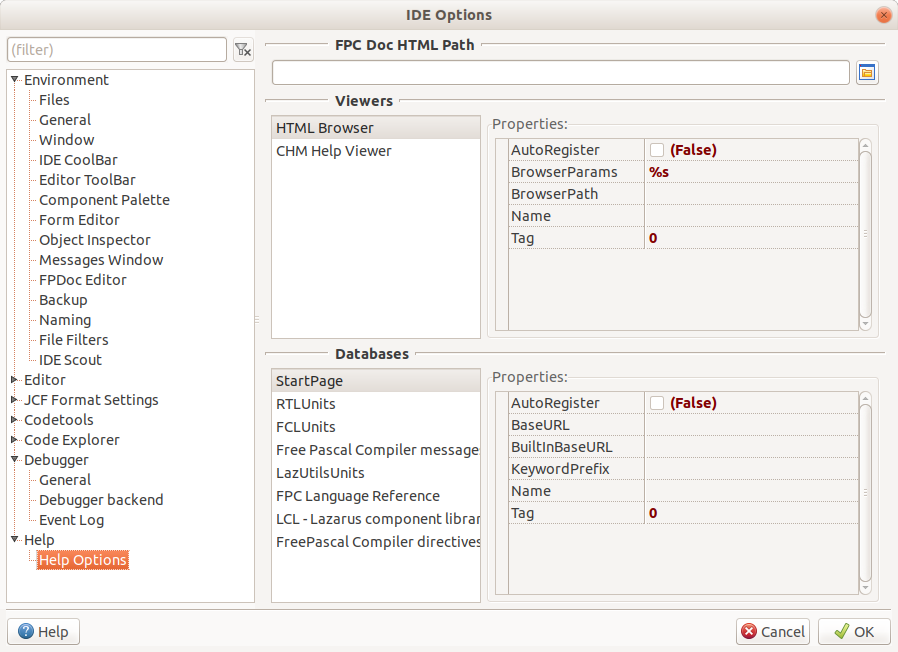 IDE Options - Help - Help Options
(Help for this tab should be presented in hints, because when nothing is yet configured...)
Help Options
HTML browser
- CHM Help viewer
- CHM help should be preconfigured if you installed Lazarus via an installer. See details on downloading/checking/configuring CHM help.
Databases
Whenever the help is invoked, databases will be scanned for help information
RTLUnits
FCLUnits
Free Pascal Compiler Messages
LazUtilsUnits
FPC Language Reference
LCL - Lazarus component library
Free Pascal Compiler Directives
External help